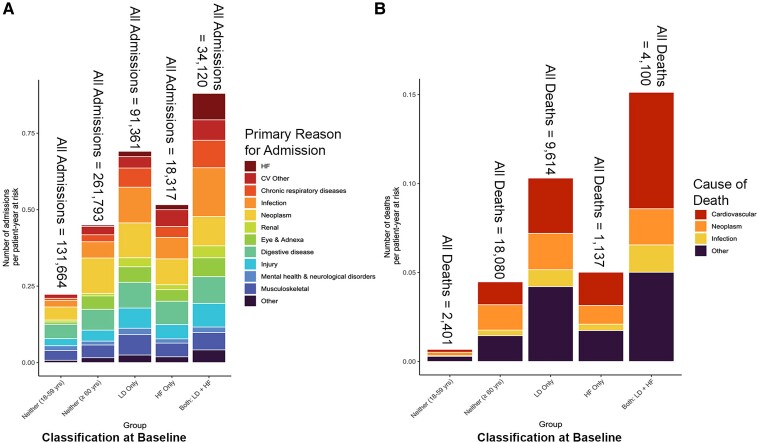
Figure 4.
Five-year event rates by patient-year at risk. (A) Hospital admission rate classified by the primary admission reason and baseline group determined by the presence or absence of a repeat prescription loop diuretics and a diagnosis of heart failure. Rates were adjusted by patient-year at risk for those eligible (i.e. not already in hospital or dead) to be admitted. The total number of admissions per group is reported above each column. Supplementary data online, Figures S12 and S13, show similar data with the loop diuretic/HF group as a time-dependent covariate. (B) All-cause mortality classified by the underlying cause of death and the baseline group determined by the presence or absence of a repeat prescription of loop diuretic and a diagnosis of heart failure adjusted for patient-year at risk where the patient was under follow-up. Patients were censored at the last medical contact (blood test, prescription, etc.) date to account for patients who moved out of the region. The total number of deaths per group is reported above each column. Supplementary data online, Figure S14, shows similar data with loop diuretic/HF group as a time-dependent covariate. n, total number of deaths; N, total number of admissions

