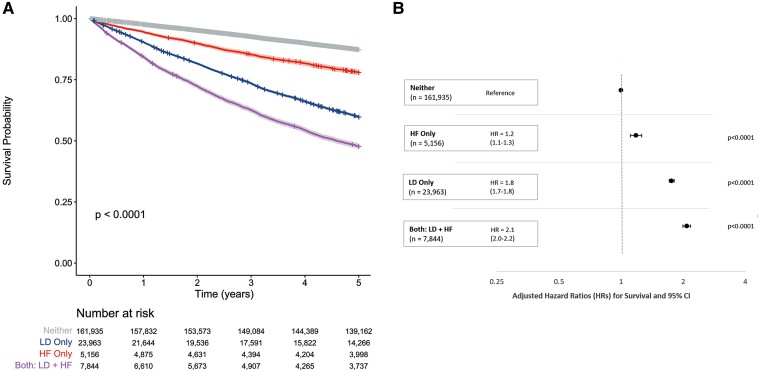
Figure 5.
Five-year survival analysis from 1 January 2012 to end of follow-up classified by baseline group according to use of loop diuretics and diagnosis of heart failure. (A) Kaplan–Meier curves to compare survival patterns by baseline group. (B) Forest plot of hazard ratios with 95% confidence intervals for all-cause mortality by baseline group. The model was adjusted for age, sex, Scottish Index of Multiple Deprivation, a history of hypertension, coronary artery disease, peripheral arterial disease, diabetes mellitus, valve disease, atrial fibrillation or flutter, stroke, cancer, dementia, and the closest eGFR in the prior 2 years

