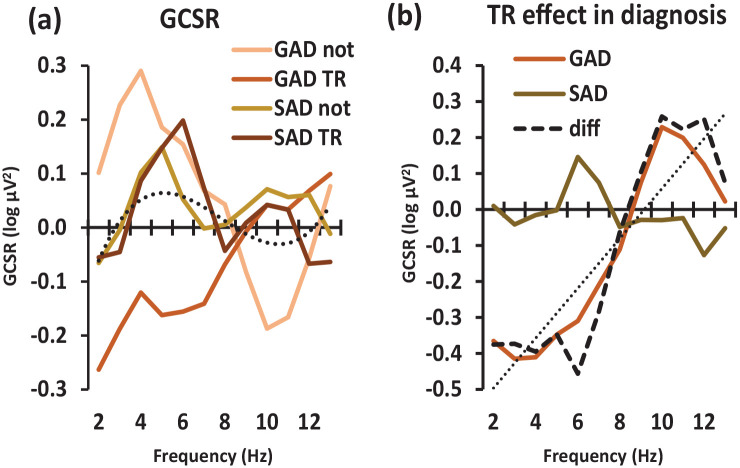
Figure 2.
Variation in goal-conflict-specific electroencephalographic rhythmicity (GCSR) power with diagnosis and frequency across 2–13 Hz in anxiety groups. (a) Power variation in GAD-not-TR, GAD TR, SAD-not-TR and SAD TR patients. The dotted line shows the significant overall cubic trend when averaging across all diagnostic groups. (b) Effect of TR (i.e. the difference between TR and not GCSR scores) comparing GAD and SAD individuals. The dashed curve represents the TR × diagnosis × frequency interaction (i.e. the difference for TR/not across GAD/SAD) and the dotted straight line represents the marginal linear trend for this interaction. The departure of the dashed curve from the straight line at 6 and 10 Hz will result in the significant order 10 polynomial component of the interaction (see text).
GAD: generalised anxiety disorder; SAD: social anxiety disorder; TR: treatment resistant.

