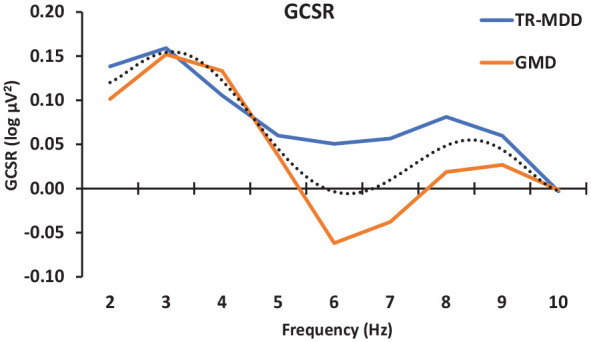
Figure 3.

Variation goal-conflict-specific electroencephalographic rhythmicity (GCSR) power across 2–10 Hz in treatment-responsive comorbid generalised anxiety and depression (GMD) and treatment-resistant major depressive disorder (MDD-TR). The dotted line shows the significant overall order 4 trend generated by the presence of both low- and high-frequency band peaks. Note that, compared to the dotted line in Figure 2(a) (cubic, order 3), this has an extra inflection produced by the additional peak in the region of 8 Hz (with a trough at 6 Hz). The differences between the groups did not reach conventional levels of significance.
