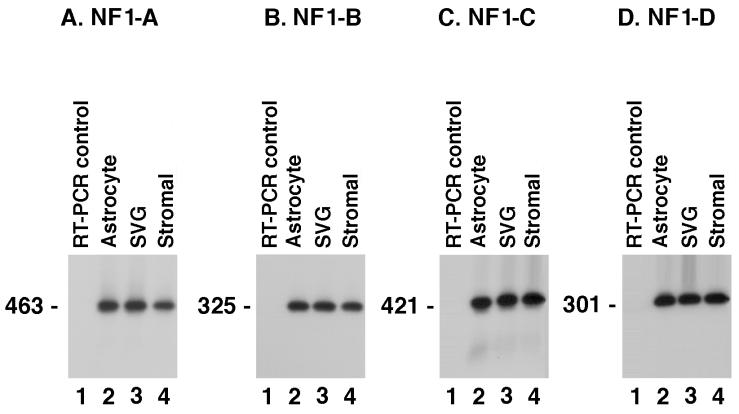
FIG. 1.
RT-PCR amplification and Southern blot analysis of human fetal brain cells (lanes 2), SVG cell line (lanes 3), and HTSC (lanes 4) using primers specific for NF-1 classes A, B, C, and D (panels A to D, respectively). All cell types examined expressed all four NF-1 classes at comparable levels. The cell types examined are those most highly susceptible to JCV infection. In each panel, lane 1 contains the negative control that corresponds to RT-PCR amplification without template. Results included are representative of three independent experiments.

