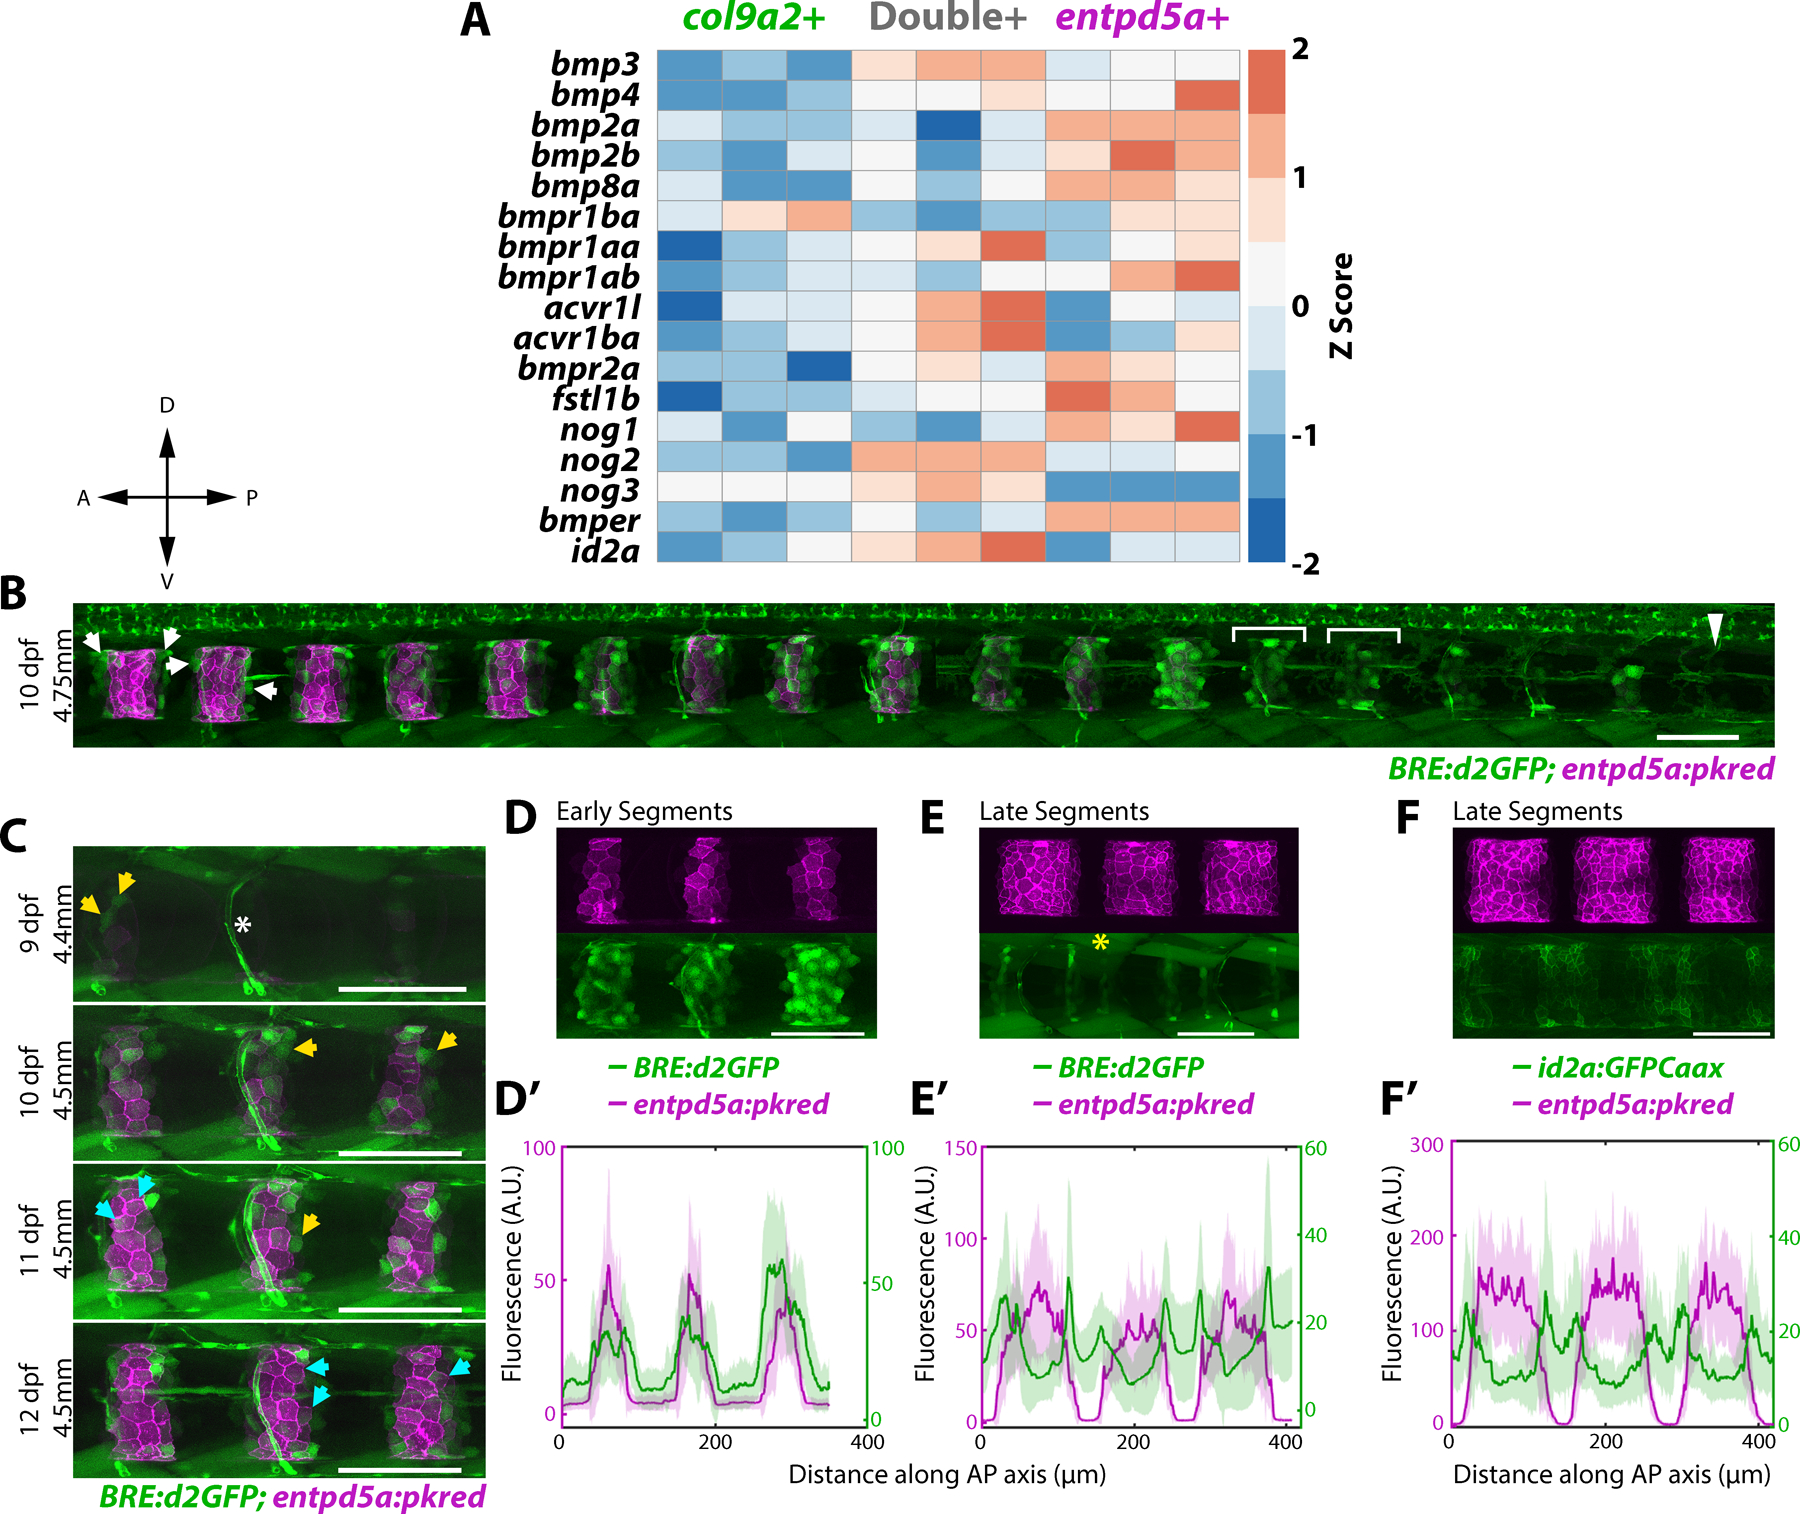
Figure 1: BMP activity is dynamic during notochord segmentation.

A) Heatmap of differentially expressed genes in three notochord domains collected from 13 dpf larvae. Primary data is from Wopat et al. 2018. Z-score values were calculated from normalized counts.
B) 10 dpf larva expressing BRE:d2GFP and entpd5a:pkred. BMP activity is ON at the center of prospective mineralizing domains (brackets) and gets restricted to segment boundaries in mature entpd5a+ domains (arrows). Arrowhead indicates unsegmented region. n=6 fish. Compass indicates A = anterior, P = posterior, D = dorsal, V = ventral
C) BRE:d2GFP and entpd5a:pkred expression in the same fish over 4 days. Yellow arrows mark cells that have turned on BRE:d2GFP, cyan arrows mark cells that have subsequently decreased BRE:d2GFP expression and activated entpd5a:pkred. n=3 fish. Asterisk marks blood vessel expression.
D) Newly formed segments expressing both BRE:d2GFP and entpd5a:pkred. n=6 fish.
D’) Fluorescence intensity plot showing overlap of the two expression patterns in (D). BRE:d2GFP peaks extending more broadly along the AP axis.
E) Mature segments expressing both BRE:d2GFP and entpd5a:pkred transgenes. BRE:d2GFP expression decreased at the center of mineralizing domains and is enriched at segment boundaries. Asterisk denotes muscle expression. n=6 fish.
E’) Fluorescence intensity plot of (E) showing BRE:d2GFP peaks flanking entpd5a:pkred expression.
F) Mature segments expressing entpd5a:pkred and id2a:GFPCaax. n=3 fish.
F’) Fluorescence intensity plot of (F).
See Figure S1
