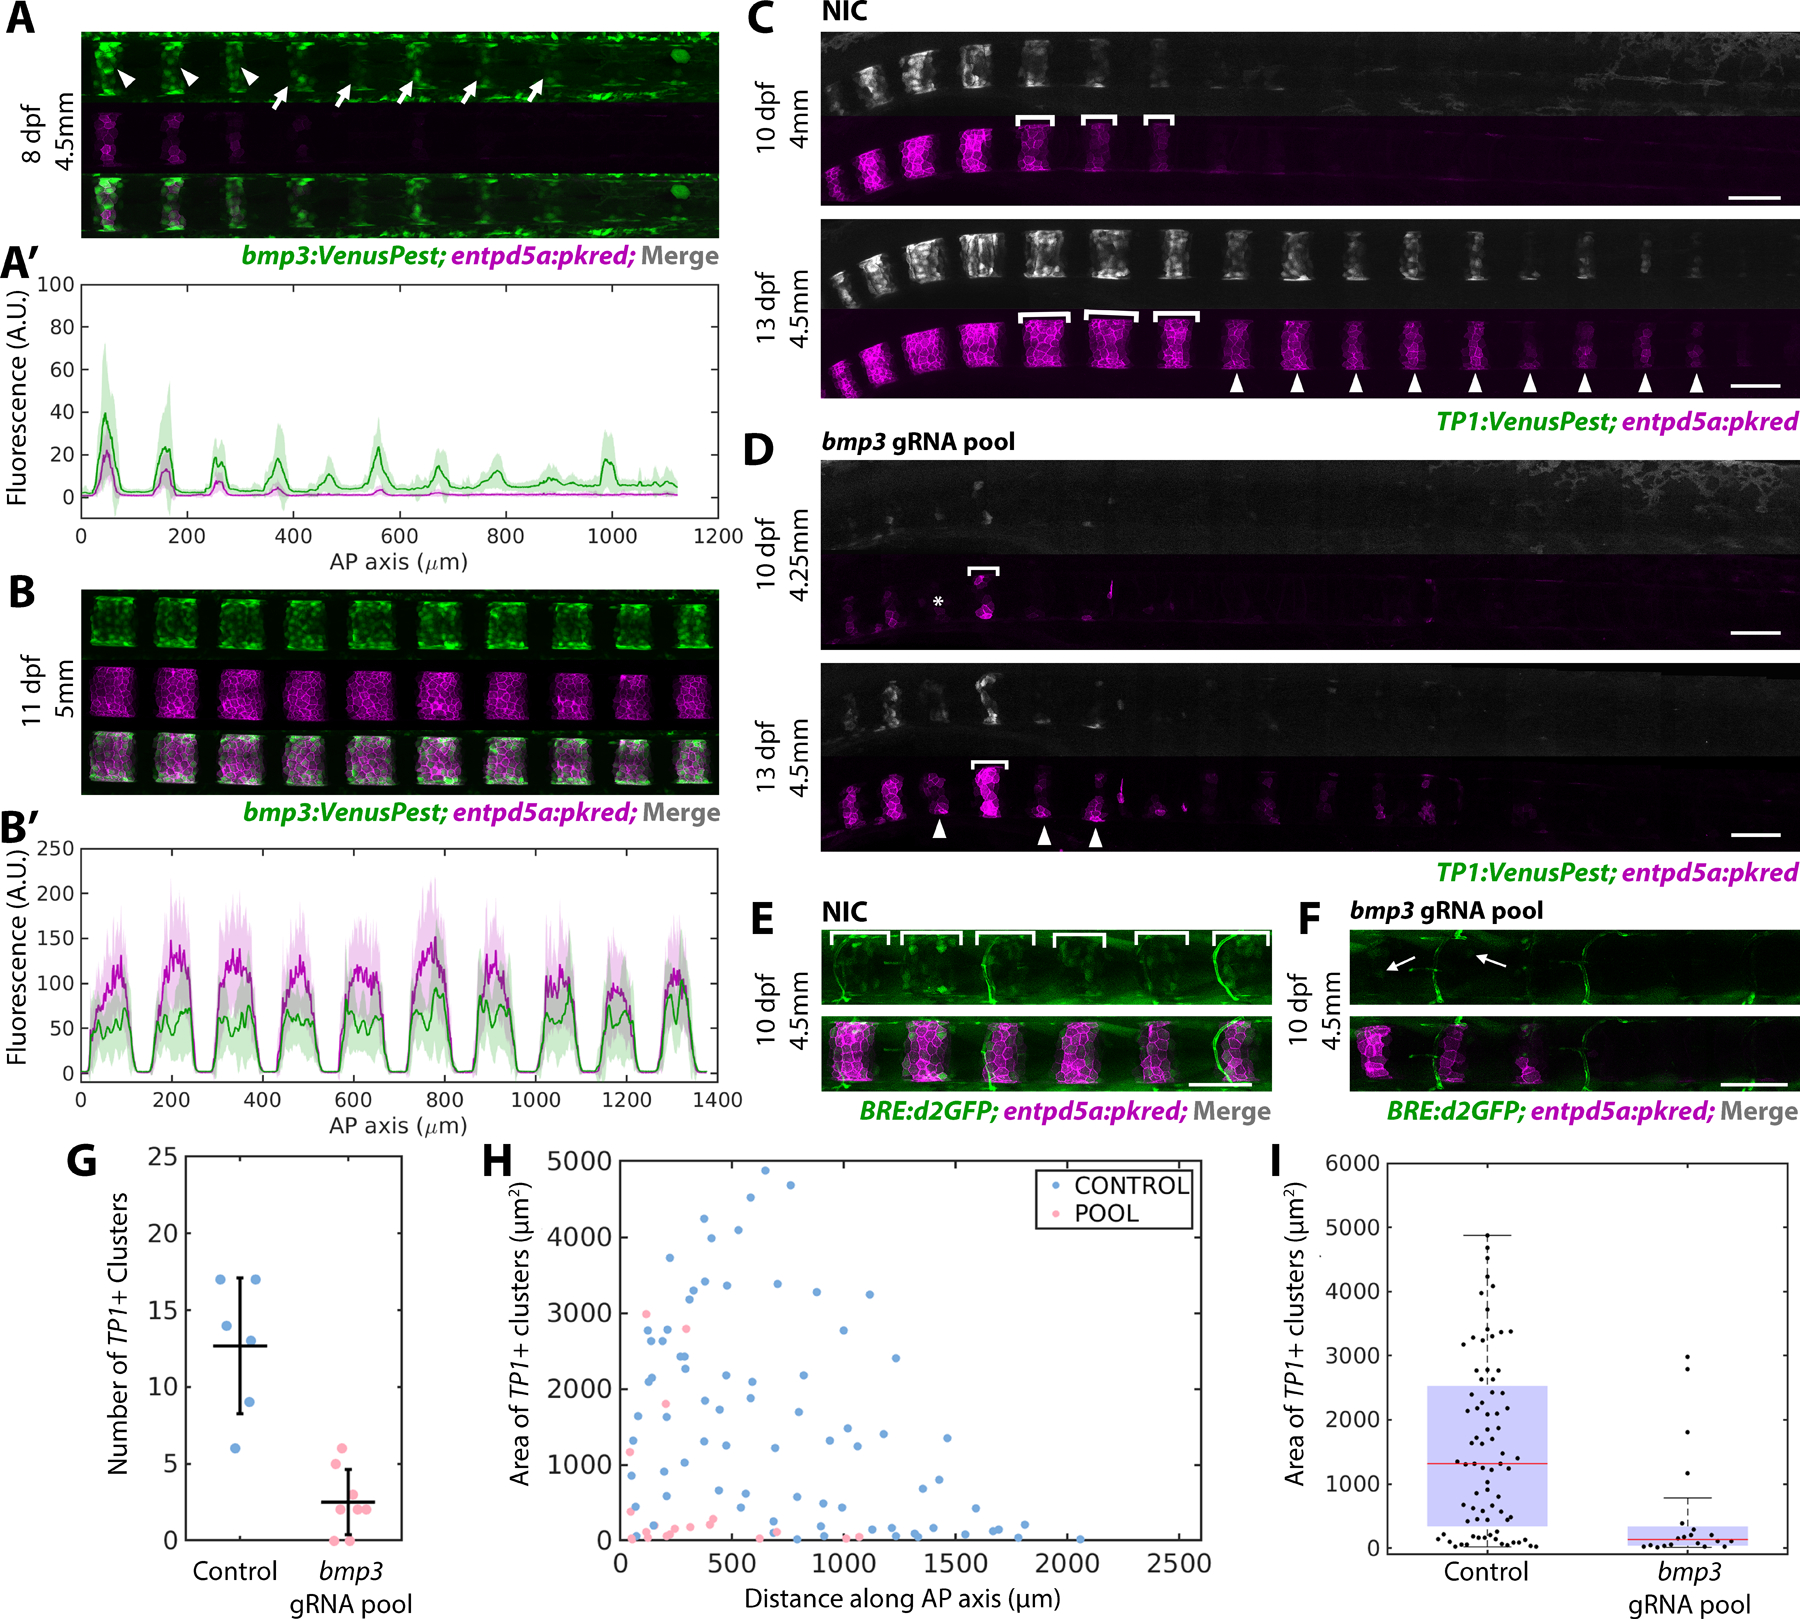
Figure 2: Bmp3 signaling precedes entpd5a activation and is required to specify mineralizing cells.

A) bmp3:VenusPest expression in the posterior of an 8 dpf larva. Arrowheads mark segments that have activated both bmp3:VenusPest and entpd5a:pkred, arrows mark bmp3:VenusPest+ segments without entpd5a:pkred. n=3 fish
A’) Fluorescence intensity plot of (A).
B) Mature segments from an 11 dpf larva expressing bmp3:VenusPest and entpd5a:pkred. n=4 fish.
B’) Fluorescence intensity plot of (B) reveals overlapping expression domains.
C) Non-injected control (NIC) larva at 10 and 13 dpf expressing TP1:VenusPest and entpd5a:pkred. Brackets indicate lateral growth between the two timepoints. Arrowheads mark new segments at 13 dpf.
D) 10 (top) and 13 dpf (bottom) larva injected with bmp3 gRNA pool. Segments are smaller, irregularly shaped, and fewer in number compared to controls. Asterisk marks a skipped segment, brackets indicate lateral growth between the two timepoints, and arrowheads point to newly formed segments at 13 dpf.
E) WT control 10 dpf larva expressing both entdp5a:pkred and BRE:d2GFP. Brackets indicate regions of BMP activity. n=6 fish/condition.
F) Larva at the same age and standard length as (E) injected with bmp3 CRISPR pool. Expression of BRE:d2GFP and entpd5a:pkred are reduced. Arrow indicates cell still expressing BRE:d2GFP. n=6 fish.
G) Number of segments at 10 dpf in fish injected with bmp3 gRNAs compared to controls (horizontal line representing mean ± standard deviation). Data was compiled using MATLAB. Loss of bmp3 caused a significant decrease in segment number. NIC n = 6, bmp3 gRNA pools n = 8, p =0.0036.
H) Area of TP1:VenusPest+ clusters measured along the AP axis in larvae injected with bmp3 gRNAs and controls at 10 dpf.
I) Distribution of segment areas from (H). Loss of bmp3 leads to decreased segment area along the AP axis. NIC n = 6, bmp3 gRNA pools n = 8, p = 6.71 × 10⁻⁵
See Figure S2
