

Summary
Nuclear localization of the metabolic enzyme PKM2 is widely observed in various cancer types. We identify nuclear PKM2 as a non-canonical RNA-binding protein (RBP) that specifically interacts with folded RNA G-quadruplex (rG4) structures in precursor mRNAs (pre-mRNAs). PKM2 occupancy at rG4s prevents binding of repressive RBPs, such as HNRNPF, and promotes the expression of rG4-containing pre-mRNAs (the “rG4ome”). We observe an upregulation of the rG4ome during epithelial-to-mesenchymal transition and a negative correlation of rG4 abundance with patient survival in different cancer types. By preventing the nuclear accumulation of PKM2, we could repress the rG4ome in triple-negative breast cancer cells and reduce migration and invasion of cancer cells in vitro and in xenograft mouse models. Our data suggest that the balance of folded and unfolded rG4s controlled by RBPs impacts gene expression during tumor progression.
Graphical Abstract

eTOC blurb
Anastasakis, Apostolidi et al. find that PKM2 binds G-quadruplexes (rG4) forming on precursor mRNAs. They show that the balance of folded and unfolded rG4s controls transcriptional output of rG4 containing RNAs (rG4ome). The rG4ome encodes EMT components and removal of PKM2 from the nucleus results in reduced tumor growth and metastasis.
Introduction
Pyruvate kinases are enzymes that catalyze the final step of glycolysis by generating pyruvate and ATP from phosphoenolpyruvate and ADP. In mammals, pyruvate kinases are encoded by two genes: PKLR, expressed in liver and red blood cells, and PKM, expressed in all other tissues.1 PKM produces two isozymes, PKM1 and 2, that differ by 22 amino acids.2 Proliferating cells and tumor cells typically express PKM2, which supports their shift in energy metabolism toward aerobic glycolysis (“Warburg effect”).3–5 A tightly regulated alternative splicing event produces the two PKM isoforms by inclusion of either exon 9 in PKM1 or exon 10 in PKM2. In proliferating cells, a set of MYC-controlled HNRNP proteins bind sequences flanking exon 9 to favor PKM2 formation.6 This MYC-driven response results in high expression levels of PKM2 in tumors.4,7
Accumulating evidence shows that non-metabolic activities of PKM2 in tumors promote aerobic glycolysis, cell proliferation, migration, and survival.4,7–10 Some of the PKM2 non-metabolic activities may be linked to the nuclear translocation of PKM2,11,12 which is widely observed in cancers and contributes to tumor progression and aggressiveness.13 ERK1/2-dependent phosphorylation of serine 37 (S37) and O-GlcNAcylation appear to drive PKM2 nuclear entry.14–16 In the nucleus, PKM2 has been hypothesized to participate in gene regulation by unknown molecular mechanisms.11,12,17,18.
RNA interactome capture, as well as crosslinking and immunoprecipitation (iCLIP) approaches recently revealed that PKM2 can directly bind RNA in vivo,19–22, analogous to > 20 other metabolic enzymes.23–25 The functional role of these ‘moonlighting’ RNA-binding proteins is poorly understood. Modulation of their enzymatic activity through RNA ligands was reported for GAPDH and ENO126,27. Some may posttranscriptionally regulate their targets, as observed for the iron response protein 1 (IRP1) that directly interacts with ferritin mRNAs to regulate iron metabolism28.
Our data reveal that PKM2, but not PKM1, is an RNA-binding protein (RBP) that selectively and specifically interacts with RNA G-quadruplex structures (rG4) with high affinity.29 Of the various RNA structures with important functional roles,30 rG4s - formed by two or more stacked guanine tetrads built by Hoogsteen hydrogen bonding - are among the most stable.29,31 Intense efforts were directed toward identifying rG4s and interacting RBPs to understand their impact on gene regulation in healthy and diseased cells32–38. In vitro and in silico approaches revealed over 13,000 sites in the human transcriptome with the potential to form rG4s39–41. There is scattered evidence that rG4s may influence many aspects of posttranscriptional regulation, including alternative polyadenylation, splicing, and miRNA biogenesis.32,35,42–45 Some rG4 sequence elements in 5’ untranslated regions (UTR) and possibly 3’ UTRs of messenger RNA (mRNA) have been reported to negatively affect translation.34,46,47 Nevertheless, the existence and relevance of rG4s in vivo remain the subject of controversial discussion.48 While immunofluorescence experiments with a specific antibody detected potentially folded rG4s in human cells49, chemical mapping — focusing on mature, predominantly cytoplasmic mRNA — suggested they are globally unfolded40. We and others identified members of the essential machinery40 resolving rG4s comprising cytoplasmic RNA helicases50,51 and RBPs.52,53 The conservation of thousands of rG4-forming sequences across the vertebrate transcriptome54,55 suggests that folded rG4s are important for gene expression. However, the cellular and developmental context in which these rG4s globally fold has yet to be captured. We present evidence that rG4 structures form in precursor mRNAs (pre-mRNAs) to promote their expression and identify RBPs that stabilize or unfold these structures to regulate gene expression.
We observed that nuclear PKM2 bound thousands of putative rG4 forming sequences (PRG4Ss) within pre-mRNAs. Furthermore, nuclear PKM2, but not PKM1, increased the expression of rG4 containing mRNAs through competition with repressive RBPs, such as HNRNPF, which bound the same unfolded G-rich sequence. Our data suggest that the interplay between stabilizing and repressive RBPs at rG4s regulate gene expression and could be the key to understanding the effect of PKM2 in promoting tumorigenesis. Furthermore, we observed an upregulation of rG4-containing mRNAs (the ‘rG4ome’) at hybrid Epithelial/Mesenchymal states of breast cancer cells undergoing EMT. Consistently, exclusion of PKM2 from the nucleus resulted in a reduced rG4ome and reduced migration and invasion of triple-negative breast cancer cells in vitro and in xenograft models. Taken together, we propose that rG4s represent a cancer-regulon and identify PKM2-rG4 RNPs as an attractive targetable vulnerability to control tumor progression.
Results
In vitro selected RNAs binding PKM2 are enriched for RNA G-quadruplexes.
Previous studies suggest that PKM2 may bind RNA in vivo.19–22 To identify sequence and/or structural determinants of PKM2 RNA-binding in an unbiased manner we performed RNA Bind-n-Seq (RBNS) assays.56 Libraries of fully randomized RNA oligonucleotides (29-mers) were mixed with recombinant PKM2 expressed either in E. coli, or purified from HEK293 cells (Figure S1A,B). The isolated PKM2-bound small RNAs were quantified by next-generation sequencing. The enrichment of sequence elements was calculated and compared to the input library composition (Figure 1A). We observed that RNAs bound by PKM2 showed a modest enrichment for 5-mers that contained G-triplets (Figure 1B). The G-triplet-containing sequences resembled the building blocks of canonical G-quadruplex (rG4) structures, which comprise three stacked Hoogsteen-bonded guanine tetrads connected by linkers of variable length29 (“three-tetrad” rG4; ((GGG(N1–7))3GGG).57,58 To examine a potential association of PKM2 with G4-forming RNAs we calculated the enrichment of sequences that contained repetitions of any of the 64 NNN triplets separated by linkers. Indeed, sequences matching the criteria for canonical rG4s were substantially enriched (Figure 1C). The enrichment of rG4-forming sequences was eliminated when performing RBNS in the presence of Li+ rather than K+ (Figure 1D), indicating interaction of PKM2 with folded rG4 structures, which typically require large monovalent cations (K+ or Na+) for their formation.29,59
Figure 1. PKM2 binds folded and HNRNPF binds unfolded RNA G-quadruplexes (rG4s) in vitro.
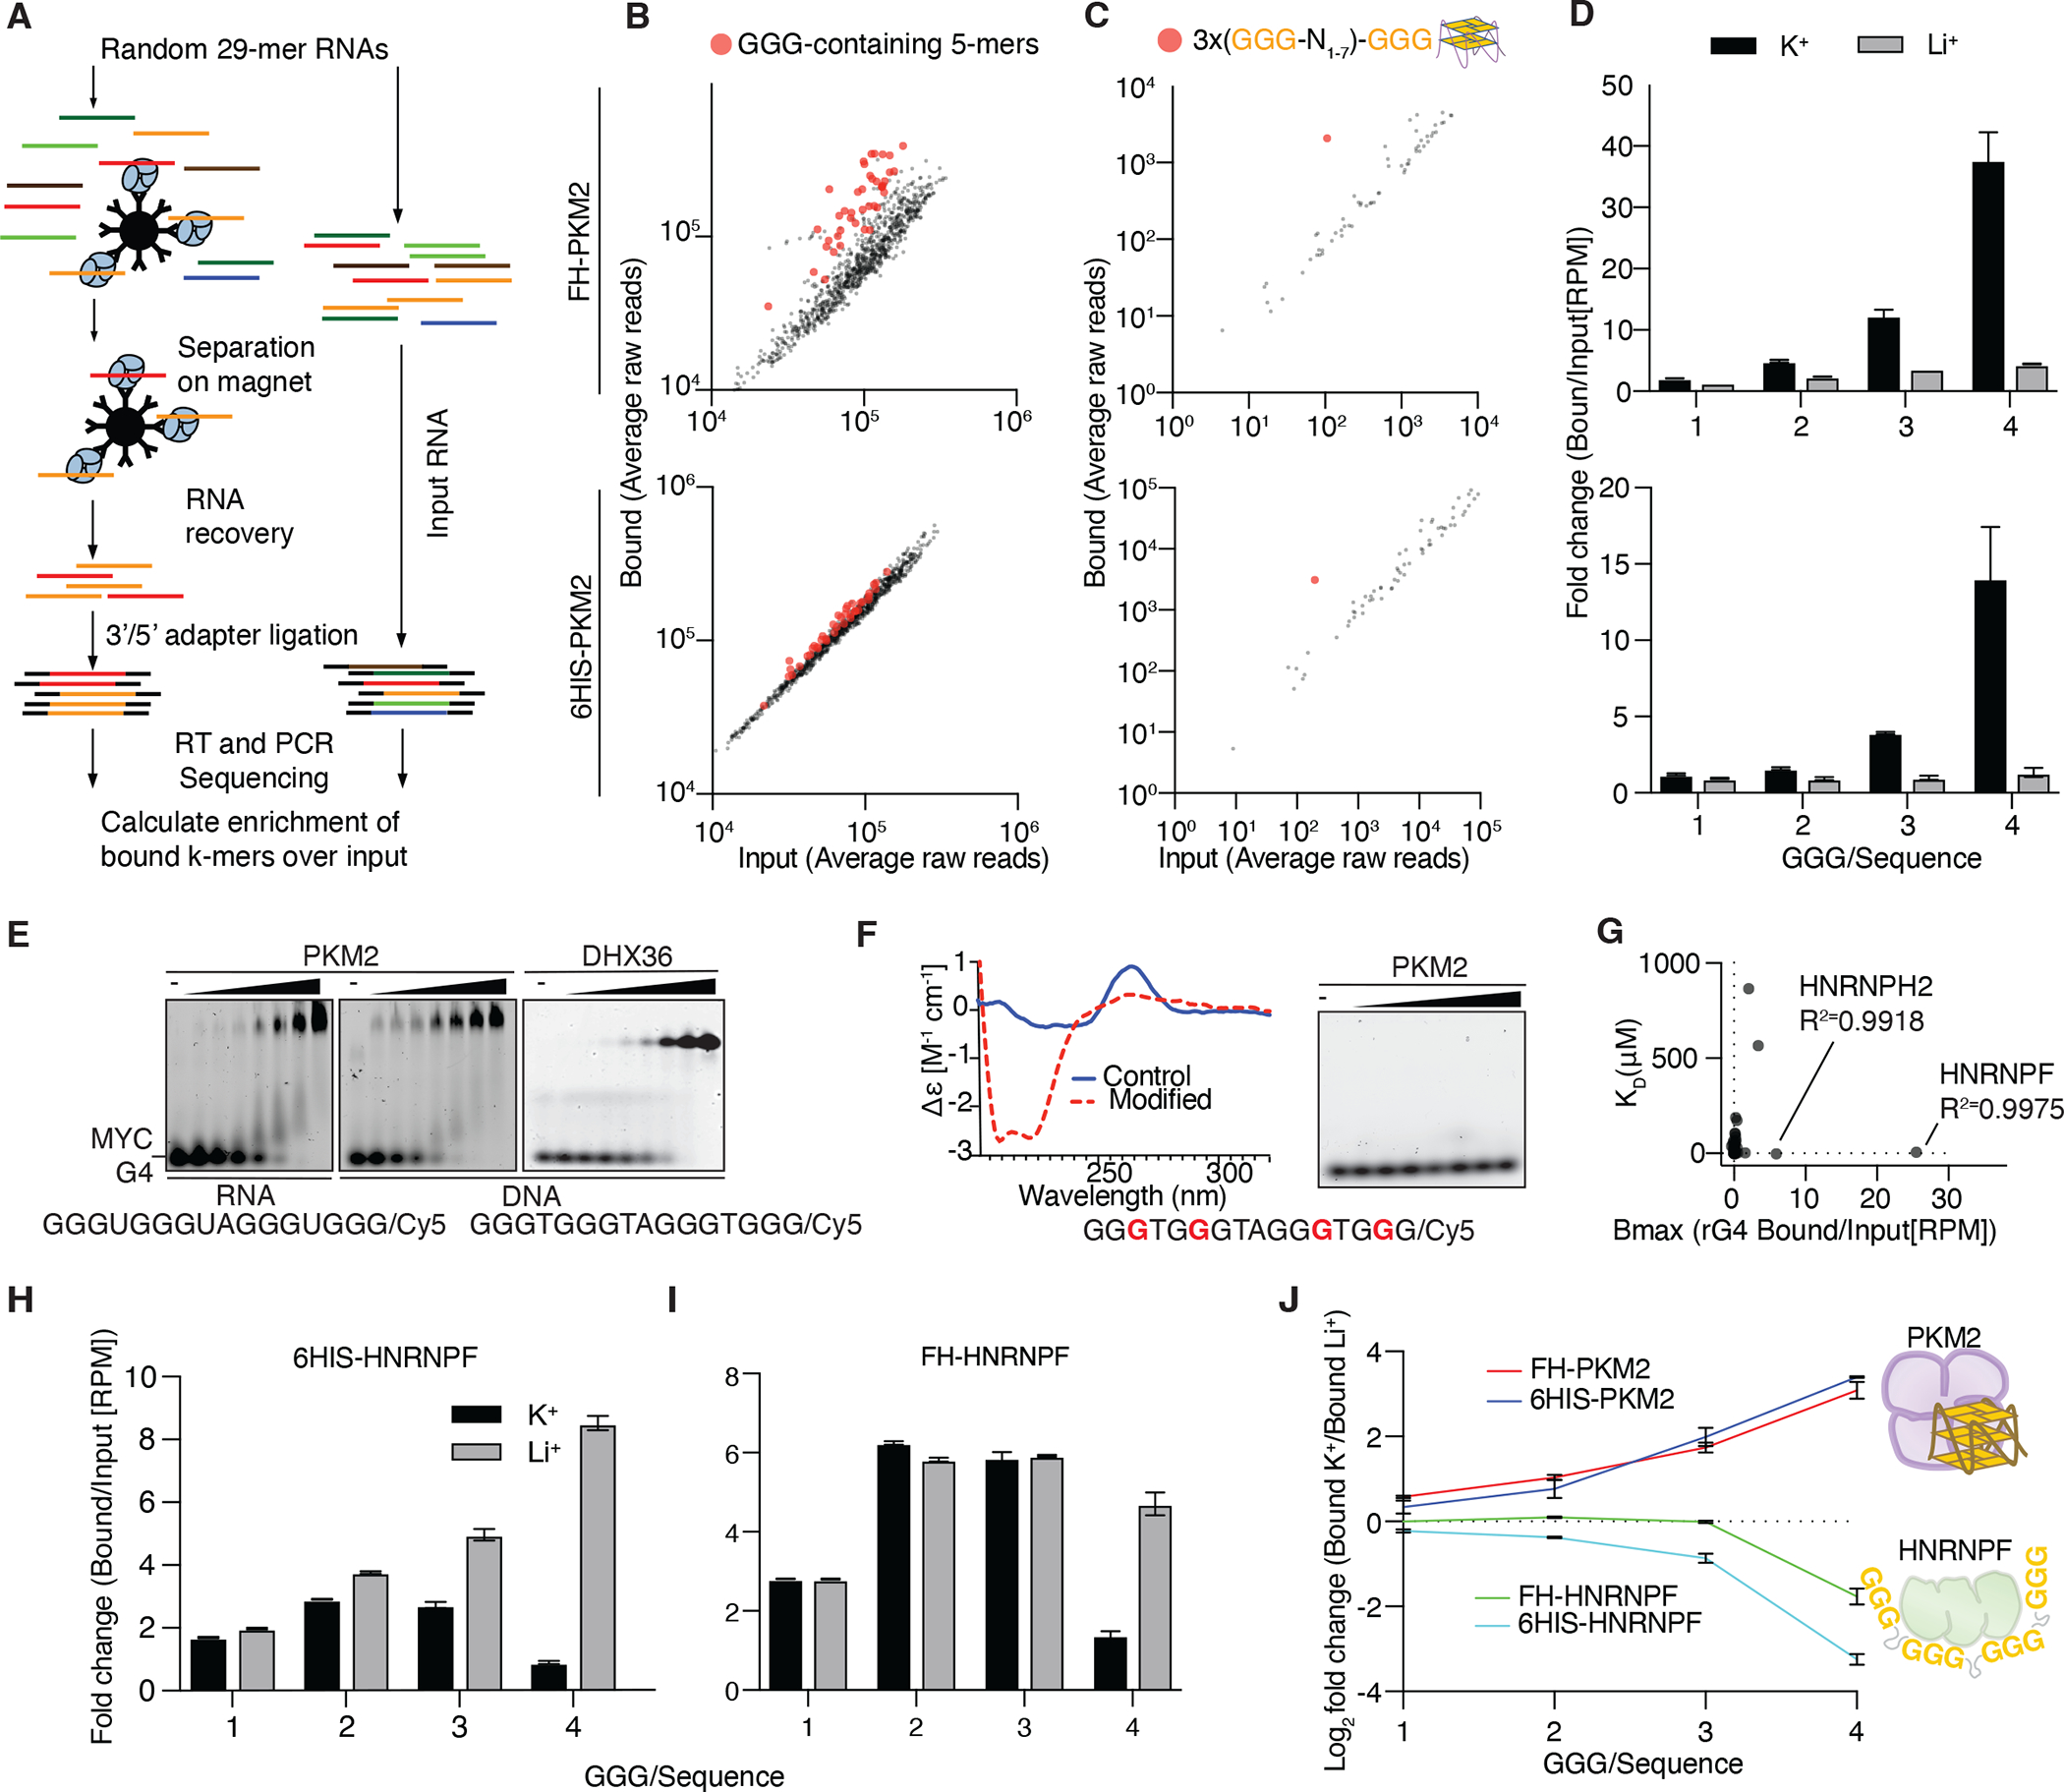
(A) Schematic of the RBNS approach. (B,C) Scatter plot of relative abundance of 5-mers (B) or four repeats of any nucleotide triplet separated by any 1–7 nucleotides (XYZ(N1–7)3XYZ) in (C) input and PKM2-bound RBNS libraries. (D) Enrichment of sequences containing 1–4 G-triplets in RBNS performed in the presence of K+ or Li+. (E) EMSA using 6HIS-PKM2 or DHX36 with the G4 forming RNA or DNA 16-mer derived from the MYC promoter. (F) Circular Dichroism (CD) spectrum of the oligonucleotide from (D) containing 8-Aza-7-deazaguanine (left panel). Modified bases are indicated in red (lower panel). EMSA using 6HIS-PKM2 and the modified sequence (right panel). (G) Affinity (KD) versus maximal enrichment (Bmax) of reanalyzed, publicly available RBNS data. from fit to . (H,I) Enrichment of sequences containing 1–4 G-triplets in 6HIS-HNRNPF (H) or FH-HNRNPF (I) RBNS performed in the presence of K+ or Li+. (J) PKM2 prefers binding to folded rG4 elements, while HNRNPF binds linear sequences. Ratio of enrichment (log2 bound over input) of sequences containing 1–4 G-triplets from RBNS experiments in the presence of K+ over Li+ for FH and 6HIS tagged PKM2 and HNRNPF.
Next, we validated the interaction of PKM2 with folded G4 structures using electrophoretic mobility shift assays (EMSA). PKM2 bound the RNA and DNA form of the widely used G4-forming sequence found in the promoter region of MYC with similar affinity (KD ~ 300 nM) as the G4-melting helicase DHX36 (KD ~ 100 nM, Figure 1E and Figure S1C).51,60 PKM2 did not bind the same sequence modified with 8-aza-7-deazaguanine, which prevents Hoogsteen base-pairing and therefore G4 structure formation (Figure 1F). Moreover, in EMSAs, PKM2 showed minimal interaction with less stable “two-tetrad” rG4 structures (Figure S1D), suggesting that it requires stably folded three-layer rG4 structures for binding and likely cannot act as an rG4 chaperone inducing their folding.61
We next asked whether rG4 binding by PKM2 affects its enzymatic activity, or whether it melts rG4 structures in vitro as many other rG4 binders do.50,51 Circular dichroism spectroscopy revealed that PKM2 did not melt folded rG4s (Figure S1E). In vitro enzymatic assays showed that PKM2-rG4 complexes had comparable enzymatic activities to free PKM2 in both less active, as well as more active states induced the physiological activator fructose-1,6-bisphosphate (FBP), suggesting that PKM2 substrate and FBP binding sites are not occluded by RNA-binding (Figure S1F). This is consistent with interactome studies in the nucleus of mouse embryonic stem cells62 that find RNA crosslinking at amino acids distant from substrate and FBP binding sites (Figure S2A). Taken together, our results indicate that PKM2 selectively and specifically interacts with folded rG4s with high affinity and does not alter their structure.
HNRNPF binds unstructured rG4 sequences, in contrast to PKM2.
We wanted to identify additional RBPs with rG4 binding activity like PKM2 and reanalyzed RBNS datasets for 78 distinct RBPs deposited in the ENCODE database.63 Among all tested proteins, only HNRNPF and the closely related HNRNPH2 exhibited appreciable selectivity for the canonical, rG4-forming motif ((GGG(N1–7))3GGG) (Figure 1G). We performed our own RBNS experiments in the presence of K+ or Li+ to identify whether HNRNPF preferred folded or unfolded rG4s as a substrate. In contrast to PKM2, we found that HNRNPF bound rG4-forming sequences (containing four GGG repeats) with higher affinity in the presence of Li+ (Figure 1H,I). This indicated that HNRNPF does bind tightly to GGG repeats via its three RRM domains64–66 but cannot bind structured rG4s like PKM2 (Figure 1J). While our approach did not reveal any additional proteins binding folded rG4 structures, we nevertheless identified HNRNPF as an RBP that could potentially compete with PKM2 for access to rG4 forming sequences in vivo. This observation guided our following functional analysis of the possible gene regulatory impact of the PKM2-rG4 interaction by considering the role of HNRNPF as a competitor.
Nuclear PKM2 and HNRNPF binds putative rG4-forming sequences (PRG4Ss) in precursor mRNAs.
Previous iCLIP experiments studying the role of PKM2 in translational regulation in the cytoplasm did not identify specific sequence interactions, but rather showed it contacted the ribosome A-site.20 Therefore, we focused on nuclear RBP-RNA interactions to determine whether PKM2 and HNRNPF interacted with and potentially competed for rG4 forming sequences in vivo.
We comprehensively mapped the RNA interactome of PKM2 and characterize its RNA recognition elements using fluorescent photoactive ribonucleoside-enhanced crosslinking and immunoprecipitation (fPAR-CLIP)67,68. Altogether, we performed 21 fPAR-CLIP experiments with endogenous or FLAG/HA-tagged PKM2 and HNRNPF in HEK293 and MDA-MB-231 cells after biochemical fractionation of nucleus and cytoplasm (Table S1). MDA-MB-231 cells express high levels of phosphorylated PKM2 (PKM2pS37), which accumulates in the nucleus13. We also verified PKM2 presence in the nucleus of HEK293 cells by probing with PKM2pS37 antibody (Figure S2B–D). The tagged versions of the proteins were expressed at significantly lower levels than the endogenous protein (6- to 20-fold), mitigating concerns about experimental artifacts introduced by overexpression (Figure S3A,B). We also performed two biological replicates of HiTS-CLIP68,69 - which does not rely on photoreactive ribonucleosides, but rather uses short-wavelength UV for RNP crosslinking - for endogenous nuclear and cytoplasmic PKM2. For all experiments, fluorescent imaging of the crosslinked and ribonuclease-treated immunoprecipitates reveals a single band migrating at ~100 kDa and ~75 kDa, corresponding to the PKM2-RNP and HNRNPF-RNP, respectively, ligated to a fluorescent 3’adapter oligonucleotide (Figure S3C). Crosslinked PKM2 and HNRNPF RNPs were isolated and protein-bound RNA fragments were transformed into small RNA cDNA libraries for next-generation sequencing. We defined RBP binding sites by generating clusters of overlapping sequence reads that harbor T-to-C conversions diagnostic of 4SU-crosslinking at higher frequencies than expected by chance70 (Table S1).
Biological replicates of individual fPAR-CLIP experiments showed high correlation (R2 between 0.8 and 1) when comparing the aligned crosslinked reads using deeptools71. Interestingly, nuclear PKM2 and HNRNPF fPAR-CLIP experiments clustered closely across all cell lines and separate from cytoplasmic PKM2 (Figure 2A). Consequently, binding sites from nuclear and cytoplasmic PKM2 fPAR-CLIPs were largely non-overlapping (Figure S3D). Our binding sites reflected the cellular compartment of origin (Figure 2B) and nuclear PKM2 and HNRNPF mainly bound pre-mRNAs (Figure 2B, Table S1).
Figure 2. PKM2 and HNRNPF bind to putative G-quadruplex forming sequences (PRG4Ss) in vivo.

(A) Correlation heatmap across all PKM2 and HNRNPF fPAR-CLIP experiments, separated by cell line. Spearman correlation coefficient indicated. (B) Average distribution of PKM2 or HNRNPF binding sites across different mRNA annotation categories in the cytoplasm or the nucleus of HEK293 and MDA-MB-231. (C) MEME motif in nuclear PKM2 and HNRNPF binding sites. (D) Metagene plot of crosslinked footprints from representative fPAR-CLIP experiments centered on PRG4Ss. (E) (Upper panel) Alignment of nuclear FH-PKM2 fPAR-CLIP reads around a PRG4S in the 3’UTR of POLD1 mRNA. (Lower panel) EMSA using 6HIS-PKM1, 6HIS-PKM2, or 6HIS-PKM2pS37 the rG4 forming oligoribonucleotide corresponding to PKM2 binding site on POLD1. (F,G) Reanalysis of 233 PAR-CLIP experiments showing the percentage of binding sites per experiment containing PRG4Ss. Panel (G) summarizes replicate experiments as boxplots.
The number of crosslinked reads per transcript in fPAR-CLIP showed little correlation to transcript abundance (Figure S3E), suggesting that our experiments captured sequence- or structure-dependent determinants of binding, rather than unspecific interactions. In line with our RBNS experiments and previous studies, a motif analysis revealed a strong enrichment of G-rich sequences in HNRNPF and nuclear PKM2 binding sites (Figure 2C Figure S3F,G). In the cytoplasm, PKM2 binding sites showed no enrichment of sequence elements, strongly suggesting that the RNA contacts were indeed mediated by interactions with the ribosome.20
Our in vitro experiments showed PKM2 and HNRNPF binding at folded or unfolded rG4s, respectively. Consistently, our fPAR-CLIP experiments identified strong binding of PKM2 and HNRNPF to putative rG4 forming sites (PRG4S), a feature we did not observe for other nuclear RBPs in fPAR-CLIP experiments (Figure 2D). We used EMSA to validate PKM2 binding to two different PRG4S that we discovered in our PAR-CLIP data, confirming that they could fold into rG4s (Figure 2E and Figure S4A–D). Recombinant PKM2 phosphorylated at S37 (Figure S4E) — the PKM2 form predominantly found in the nucleus — retained even higher affinity for the same rG4s (Figure 2E). Interestingly, neither recombinant PKM1, nor the closely related E. coli homolog pykF (43% identity), bound these PRG4Ss (Figure 2E and Figure S1B,D). This suggests that PKM2 rG4 binding activity arose with the vertebrate-specific splicing of PKM and is linked to the 22 amino acids encoded by the alternative exon 10, either directly or indirectly through conformational changes.
We next mined 221 PAR-CLIP experiments available to us (Table S2) to identify RBPs interacting with PRG4Ss in living cells. Nuclear PKM2 and HNRNPF ranked as the most prominent PRG4S binding proteins in addition to DHX36 and CNBP — which we previously studied as rG4 resolving proteins — and DDX3X with a broader activity in resolving structured mRNA (Figure 2F,G, Table S2). Notably, unlike HNRNPF and PKM2 which are nuclear proteins, DHX36, CNBP, and DDX3X localize mainly to the cytoplasm. Thus, we proceeded to focus on elucidating the relationship between nuclear PKM2 and HNRNPF and their impact on gene expression of rG4-containing mRNAs.
PKM2 and HNRNPF compete for access to rG4s.
The evidence gathered so far led us to conclude that when PKM2 localizes to the nucleus, it interacts with folded rG4 structures. Meanwhile, HNRNPF may act as a competitor, as it binds to the same, but unfolded, PRG4Ss. If PKM2 and HNRNPF competed for access to the same PRG4Ss, one would predict that: 1.) the binding profile on PRG4Ss substantially overlaps and 2.) that removing one of the RBPs from the nucleus would result in increased binding of the other to PRG4Ss. We decided to test these predictions in MDA-MB231 cells. fPAR-CLIP for endogenous PKM2 or HNRNPF (Figure 2B,C) showed that both proteins shared a substantial number of binding sites, which were enriched at PRG4Ss (Figure 3A–C).
Figure 3. PKM2 and HNRNPF compete for access to PRG4Ss in vivo.

(A) PKM2 and HNRNPF bind similar sites, shown by metagene analysis of crosslinked sequence read coverage from PKM2 PAR-CLIP around HNRNPF binding sites (left panel) or from HNRNPF PAR-CLIPs around PKM2 binding sites. (B) Coverage of HNRNPF and PKM2 binding sites on MALAT1. (C) Venn diagram of binding site overlap for endogenous PKM2 and HNRNPF. (D) Proportion of sequence reads containing the canonical PRG4S in four biological replicates of HNRNPF fPAR-CLIP in MDA-MB231 expressing wild-type (WT) PKM or PKM fused to a nuclear export signal (PKMNES).
Next, we depleted PKM2 from the nucleus and asked whether occupancy of HNRNPF on PRG4Ss increased. To remove PKM2 from the nucleus, we used CRISPR/Cas9 mediated editing to introduce a NES at the PKM1/2 C-terminus72. As expected, the fusion protein (PKMNES) did not show any trace of nuclear localization (Figure S5A). Then, we compared four biological replicates each of HNRNPF fPAR-CLIP experiments using MDA-MB231 cells expressing wild-type PKM or PKMNES and found that excluding PKM2 from the nucleus increased HNRNPF interaction with PRG4Ss (Figure 3D). Thus, PKM2 and HNRNPF indeed compete for the same set of binding sites.
Depletion of nuclear PKM2 decreases abundance of its pre-mRNA targets.
Now that we established that PKM2 and HNRNPF preferentially interacted with PRG4Ss found across precursor mRNAs, we next aimed to understand their gene regulatory impact using loss- and gain-of-function analyses. In our HEK293 model cell lines, PKM2 is the main pyruvate kinase expressed and thus we did not directly knock out or knock down PKM2 to avoid anticipated secondary effects due to changes in metabolic activity. Rather, we generated stable HEK293 cell lines expressing FH-PKM2 fused to an NES at its C-terminus that abrogated nuclear localization and depleted remaining endogenous PKM2 — which may enter the nucleus — with siRNAs targeting the 3’UTR of the PKM mRNA (Figure 4A, S5B). To ensure that tagging at the N-terminal or C-terminal of the protein does not impair its metabolic activity we measured either pyruvate kinase activity of cell extracts or ATP production by purified proteins in the presence of ADP and phosphoenolpyruvate (Figure S5C,D). Tagging of the protein with N-terminal FH and C-terminal V5-tags did not change its activity, while unexpectedly, PKM2-NES constructs exhibited even higher pyruvate kinase activity as measured by both methods. This implies that nuclear shuttling of PKM2 does not impair its catalytic activity.
Figure 4. PKM2 and HNRNPF competitively regulate rG4-containing transcripts in vivo.

(A) (Left panel) Quantification of nuclear FLAG signal in cells expressing FH-PKM2 and FH-PKM2-NES. (Right panel) Immunoblot confirming silencing of endogenous PKM and expression of FH-PKM2-NES. (B) mRNA expression changes after silencing of endogenous PKM2 in cells expressing FH-PKM2-NES. The empirical cumulative distribution function (CDF) of nuclear PKM2 targets binned according to the number of canonical rG4s crosslinked to PKM2 (GGG(N1–7)3-GGG) in their exons (left panel), in introns within 200 nt from splice sites (middle panel) or greater than 200 nt (right panel). (C) (Upper panel) Immunoblot confirming expression of FH-PKM2-NLS after doxycycline induction. (Lower panel) Immunofluorescence analysis showing nuclear localization of FH-PKM2-NLS; Scale bar, 15 μm. (D) mRNA expression changes after expression of FH-PKM2-NLS. CDF of genes binned according to the number of canonical rG4s (GGG(N1–7)3-GGG) in their exons (left panel), in introns within 200 nt from splice sites (middle panel) or greater than 200 nt (right panel). (E) (Upper panel) Immunoblot confirming expression of FH-HNRNPF after doxycycline induction. (Lower panel) Immunofluorescence analysis showing nuclear localization of FH-HNRNPF; Scale bar, 15 μm. (F) mRNA expression changes after expression of FH-HNRNPF. CDF of genes binned according to the number of canonical rG4s (GGG(N1–7)3-GGG) in their exons (left panel), in introns within 200 nt from splice sites (middle panel) or greater than 200 nt (right panel). Nuclei, Hoechst 33342 (blue); FLAG, Alexa Fluor 594 (red); Scale bar, 20 μm. *P ≤ 0.05, **P ≤ 0.01, ***P ≤ 0.001, ****P ≤ 0.0001, Mann-Whitney U test (MWU).
Using these cell lines for transcriptome profiling, we found that exclusion of PKM2 from the nucleus led to a significant decrease in mRNA levels of nuclear PKM2 PAR-CLIP targets. The magnitude of this effect was dependent on the overall strength of binding (defined by the number of crosslinked reads normalized by transcript abundance) with the expression levels of the top 10% of targets (n = 208) reduced on average by 10% (Figure 4B). We further refined our target list by restricting binding sites to those containing the canonical rG4 motif either in exons, introns close (≤ 200 nt) to splice sites, or deep within the intronic sequence space (Figure 4B). In all cases, we observed that loss of nuclear PKM2 resulted in reduced levels of target mRNAs. In exons or close to splice sites, even a single PKM2-bound rG4 was sufficient to elicit this effect, while bound intronic rG4s further removed from splice sites were not as predictive of regulation by PKM2 (Figure 4B). This phenomenon was independent of the cell line used and similar results were obtained in another cell line with nuclear PKM213, MCF-7, after depletion of nuclear PKM2 (Figure S5E–G). We concluded that in the nucleus PKM2 promotes expression of its targets.
Nuclear PKM2 and HNRNPF have opposite effects on the expression of rG4-containing mRNA.
We hypothesized that in the nucleus, PKM2 binds to rG4s forming on nascent RNA and protects them from unfolding by RBPs binding linear G-rich elements, such as HNRNPF, resulting in upregulation of rG4 containing RNAs. Therefore, increasing levels of PKM2 in the nucleus should result in a commensurate increase of expression of rG4 containing mRNA (the ‘rG4ome’), while increased levels of HNRNPF should oppose this effect. To test this prediction, we generated a stable HEK293 cell line expressing an inducible PKM2 fused to a nuclear localization signal (FH-PKM2NLS) (Figure 4C) and quantified mRNA expression using RNA-seq. Considering the substantially increased levels of PKM2 in the nucleus, we expected that PKM2 is now able to engage with a substantial proportion of the rG4ome. Therefore, we binned transcripts based on the presence and number of canonical PRG4Ss and found that increasing levels of nuclear PKM2 significantly increased the abundance of rG4 containing mRNAs with the magnitude of the effect depending on the number of predicted rG4s within exons or near the splice sites (Figure 4D). At the same time, increasing the levels of HNRNPF (Figure 4E) resulted in a decrease of those rG4-containing mRNAs (Figure 4F). Taken together, our results indicate that the balance of folded and unfolded rG4 elements directly affects mRNA expression, and that shifting this balance to favor folding — either by removing the repressive HNRNPF or expression of PKM2 — will result in increased expression of the rG4ome.
Nuclear PKM2 promotes expression of rG4-containing pre-mRNAs in a co-transcriptional manner.
DNA G4 structures forming in gene promoters represent regulatory elements controlling transcription.73 Nevertheless, while PKM2 is capable to interact with DNA G4 structures in vitro (Figure 1E), nuclear PKM2 did not affect expression of genes with G4s in their promoter in HEK293 or MCF7 cells (Figure S5G,H). Moreover, nuclear PKM2 did not affect the expression of genes with G4 elements on the template strand of the gene body, i.e., the reverse complement of the RNA transcript, further supporting that rG4 structures, rather than DNA-G4 structures, are the relevant PKM2 targets in living cells (Figure S5I).
Our data showed that PKM2 prominently bound pre-mRNA, i.e., nascent transcripts, which led us to test if this interaction affected transcriptional dynamics. To address this, we used ChIP-seq targeting the unphosphorylated C-terminal domain (CTD) of the large PolII subunit RBP1, which mainly recovers inactive PolII recruited to gene promotors. We found a decreased occupancy of PolII at transcription initiation sites of PRG4S-containing mRNAs upon expression of FH-PKM2-NLS (Figure 5A). Another set of ChIP-seq experiments targeting CTD phosphorylated at serine 2 (S2P), which marks elongating PolII, revealed an increase in elongating PolII upon expression of FH-PKM2-NLS (Figure 5B), and thus, likely an increased transcriptional output of PRG4S-containing mRNAs. This is mirrored in an overall increase of RNAseq sequence reads derived from introns of of PRG4S-containing mRNAs (Figure 5C), a metric which can be used to measure transcriptional activity74. At the same time, the overall ratio of intronic to exonic reads on rG4 mRNAs did not change (Figure 5D), indicating that despite the increase in nascent transcripts, mRNA processing remained efficient. Thus, we concluded that PKM2 affects PRG4S-containing mRNAs during transcription.
Figure 5. PKM2 binding and rG4 formation promotes transcription elongation.

(A,B) Polymerase occupancy changes of total PolII near transcription start site (A) or elongating PolII (CTD phosphorylated at S2) along the gene body (B). Transcripts were binned according to the number of canonical rG4 motifs (GGG(N1–7)3GGG) in their exons or within 200 nt of the 5’ or 3’ splice site. *P ≤ 0.05, **P ≤ 0.01, ***P ≤ 0.001, ****P ≤ 0.0001; Mann-Whitney U test (MWU). (C,D) Abundance changes of intronic reads (C) or ratio of intronic/exonic reads (D) upon expression of FH-PKM2-NLS. Transcripts were binned according to the number of canonical rG4 motifs (GGG(N1–7)3GGG) in their exons or within 200 nt of the 5’ or 3’ splice site.
rG4-containing mRNAs are upregulated in cells undergoing partial EMT.
Previous reports show that nuclear translocation of PKM2 promotes invasive properties of tumor cells.17,18 Consistently, a Gene Set Enrichment Analysis (GSEA) of transcriptional changes in FH-PKM2-NLS-HEK293 cells showed a significantly increased expression of multiple gene sets connected with tumorigenesis, most notably epithelial-to-mesenchymal transition (EMT)-related genes (Figure 6A).75 To test whether the rG4ome is related to EMT phenomena, we reanalyzed gene expression data from an established breast cancer model of EMT.76 In this model, cells can be separated into three phenotypic states: a basic, less tumorigenic state (E), an epithelial/mesenchymal hybrid (E/M) state that is strongly associated with tumor invasiveness and metastasis, and a final mesenchymal state (xM) that is less tumorigenic. We found that the top upregulated mRNAs after overexpression of PKM2 in the nucleus were also highly enriched when cells transit from the E to the aggressive E/M state. In contrast these same mRNAs were downregulated by HNRNPF overexpression (Figure 6B), highlighting a potential competition with PKM2 and supporting a previously reported inhibitory role of HNRNPF on EMT.77 As cells acquired the E/M state, we again saw a dramatic increase in abundance of the rG4ome in E/M compared to E cells (Figure 6C,D). Notably, as the cells transition from the aggressive E/M state to the less tumorigenic xM state, the rG4ome decreases in abundance again (Figure 6E). We speculated that the PKM2-rG4 interaction may allow a rapid modulation of key gene sets marked by rG4 to promote a migratory phenotype, which correlates to transitional phases of tumorigenesis and metastasis, thereby providing the observed link between the rG4ome expression and cancer. Consistently, cell migration regulatory pathways and genes related to cell motility were significantly enriched in a gene ontology (GO) analysis of rG4-containing transcripts upregulated by PKM2 in the nucleus (Figure S6).
Figure 6. The rG4ome is associated with aggressive cancer phenotype.

(A) Scatter plot of hallmark gene sets enriched among genes upregulated by FH-PKM2-NLS expression (−log10 p-value versus Enrichment Score). (B) Gene Set Enrichment Analysis of transcripts upregulated by nuclear PKM2 (determined in HEK293) in HMLER cells as they transition from a less tumorigenic E-state to the highly aggressive hybrid E/M state. (C,D) mRNA expression changes comparing cells in the aggressive E/M state with the basic E-state. Transcripts were binned according to the number of canonical rG4 motifs (GGG(N1–7)3-GGG) in their exons (C) in their introns within 200 nt of the splicing sites (D). E Violin plots of the relative expression of transcripts with 0 (left panel), 1–6 (center panel), or more than 6 (right panel) PRG4Ss in their exons or introns near a splicing site for E, EM and xM cells. (F) mRNA expression changes upon treatment of MDA-MB-231 cells with 5 μΜ TEPP-46. Transcripts were binned according to the number of canonical rG4 motifs (GGG(N1–7)3-GGG) in their exons or within 200 nt of the 5’ or 3’ splice site. (G) Dot plot of cell front velocity in wound healing assay. (H) Dot plot of the proportion of invading cells per tested area of Matrigel-coated transwell filters in invasion assays. *P ≤ 0.05, **P ≤ 0.01, ***P ≤ 0.001, ****P ≤ 0.0001; two-tailed t-test.
rG4ome expression correlates with poor patient prognosis in cancer.
Considering that EMT genes, cell migratory pathways, and genes related to cell motility are enriched in the rG4ome, we wondered whether rG4ome upregulation is a hallmark of cancer subtypes, or aggressive cancers in general. We reanalyzed the entire set of RNAseq data available from The Cancer Genome Atlas (TCGA) and stratified samples from various cancers by expression levels of the rG4ome (mRNAs with ≥ 4 rG4 elements per transcript). We observed for all cancer subtypes that some samples stood out with comparatively high expression of the rG4ome. Independent of cancer type, high expression of the rG4ome correlated with poor prognosis, e.g., in acute myeloid leukemia, breast cancer, renal adenocarcinoma, or cutaneous melanoma (Figure S7A). The poor prognosis for patients with cancers expressing high levels of the rG4ome was even more pronounced when combining all available TCGA datasets (Figure S7B).
Exclusion of PKM2 from the nucleus reduces lung metastases in mouse xenografts.
In a previous study,13 we found a small molecule, TEPP-46, that acts as an isoform-specific pyruvate kinase activator, also reduced nuclear PKM2 levels and attenuated aggressive phenotypes in a triple-negative breast cancer (TNBC) model. We therefore treated MDA-MB-231 TNBC cells with TEPP-46 to reduce nuclear PKM2 levels and profiled rG4ome levels by RNA-seq. Indeed, TEPP-46 treated cells showed a reduction of the rG4ome, as well as decreased migratory and invasive properties (Figure 6F–H). This confirms that nuclear PKM2 localization plays a critical role in shaping the transcriptome of highly aggressive cancer phenotypes via rG4 interactions. Consequently, we reasoned that cell lines that are engineered to exclude PKM2 from the nucleus would show reduced tumorigenicity in xenograft models. Therefore, we used CRISPR-Cas9 mediated gene editing to introduce an FH-tag on the N-terminus and an NES on the C-terminus of the PKM1/2 proteins in MDA-MB231 cells. We obtained a set of cells homozygous (PKM-NES-FH/PKM-NES-FH) for the edits (Figure 7A). Cell lines heterozygous for the introduction of an FH-tag on the PKM1/2 N-terminus (PKM-FH/WT) served as controls. We again assessed the metabolic activity of purified PKM2 from these cell lines and ruled out that introduction of the FH tag or the NES interfered with PKM2 tetramerization or metabolic activity (Figures 7B, S7C). PKM-NES-FH/PKM-NES-FH cells showed decrease migration in a scratch assay (Figures 7C). We used these cell lines for xenograft experiments and injected 107 cells into immunocompromised mice and followed tumor growth. Tumors from homozygous PKM-NES-FH/PKM-NES-FH cells grew slower (Figure 7D,E) compared to those from heterozygous PKM-FH/WT or parental MDA-MB231 cells. Exclusion of PKM2 from the nucleus also allowed mice to survive longer in the xenograft experiments (Figure 7F). RNAseq analysis of extracted tumor tissue from the primary tumor showed that as in our other experiments, exclusion of PKM2 from the nucleus resulted in reduced expression of the rG4ome (Figure 7G). Since MDA-MB-231 xenografts result in robust metastases we analyzed lungs for presence and size of metastases once the primary tumors reached a size of ~1,600 mm3. We examined lung sections across five animals each, xenografted with parental MDA-MB-231, MDA-MB-231PKM-FH/WT, and MDA-MB-231PKM-NES-FH/PKM-NES-FH, respectively. Mice implanted with homozygous cells showed a striking more than 5-fold decrease in the relative size of metastases (Figure 7H), consistent with our observation that the rG4ome upregulated by PKM2 is enriched for genes from cell migratory pathways (Figure 6A). Taken together our xenograft experiments supported the data we collected showing that: 1.) translocation of PKM2 to the nucleus results in the upregulation of the rG4ome, and 2.) that upregulation of the rG4ome results in an increase tumor growth and metastatic burden.
Figure 7. Nuclear PKM2 promotes lung metastasis.

(A) Immunoblot analysis showing expression of PKM endogenously tagged with either FH or NES-FH using anti-FLAG or anti-PKM2 antibodies. (B) ATP production in the presence of ADP and pyruvate (left panel, endpoint; middle panel, kinetics) from proteins purified by anti-FLAG immunoprecipitation (IP) from parental, MDA-MB-231PKM-FH/WT and MDA-MB-231PKM-NES-FH/PKM-NES-FH cells. (Right panel) Pyruvate kinase assay using extracts from parental cells. (C) Dot plot of cell front velocity in wound healing assay of MDA-MB-231PKM-FH/WT and MDA-MB-231PKM-NES-FH/PKM-NES-FH cells (D) Exclusion of PKM2 from the nucleus decreases tumor size. Primary tumor size of xenografts in NOD scid gamma (NSG) mice subcutaneously injected in the right flank with 107 cells of either parental MDA-MB-231 (black line), heterozygous PKM-FH/WT (gray line), or homozygous PKM-FH-NES cells. (E) Primary tumor size from (D) 44 days after injection. (F) Kaplan-Meier survival curves for the three groups from (D). (G) mRNA expression changes comparing gene expression in the primary tumor of xenografts of MDA-MB231 cells homo- or heterozygous for FH-NES-PKM expression. Transcripts for cumulative distribution function were binned by the number of PRG4Ss identified by fPAR-CLIP from parental MDA-MB231 cells. (H) Representative images of FLAG IHC staining in lung sections from metastases from xenografts of PKM-FH/WT heterozygous or PKM-NES-FH/PKM-NES-FH homozygous MDA-MB231 cells (left and middle panels); Scale bar, 1 mm. Mean values of fraction of metastasis in lungs (by volume, right panel).
Discussion
PKM2 as rG4-interacting RBP.
Our study shows that, in addition to its well-characterized role in the energy metabolism, PKM2 can bind rG4 in the nucleus, establishing it among the >20 metabolic enzymes known to bind RNA25. The effects of RNA-binding to metabolic enzymes have been poorly characterized, but include: 1.) modulation of their enzymatic activity, as seen for GAPDH26 or ENO1,27 2.) feedback control of expression of mRNAs encoding components of the same metabolic pathways, as shown for iron response protein 1 (IRP1) binding to ferritin mRNAs to regulate iron metabolism,28 or 3.) use of RNA as scaffolds to support the formation of either larger assemblies of the metabolic enzymes to form a ‘metabolon’,78 or of heteromeric complexes, analogous to the proposed role of RNA in the formation of the PRC2 complex.79,80 Translocation of PKM2 to the nucleus removes it from its normal role in glycolysis and allows it to posttranscriptionally regulate the expression of hundreds of mRNAs. Our results suggests this mechanism could contribute to the large-scale rewiring of gene expression programs during metastasis, but also in the context of other phenotypic transitions, such as in development, where nuclear PKM2 is required for T-cell differentiation.81
Mechanistically, our data suggest that PKM2 affects the efficiency of co-transcriptional mRNA processing feeding back on transcription itself82, considering: 1.) that it acts in the nucleus, 2.) that intronic and exonic rG4 sites close to splice sites confer regulation, 3.) that intronic rG4 sites found more than 200 nt removed from splice sites are occupied but do not affect RNA levels, 4.) that we find no evidence of systematic splicing pattern changes, and 5.) that importantly, we find increases in transcriptional elongation rates. Intriguingly, the Tollervey group found that RNA secondary structures forming close to elongating RNA polymerases promote transcription and prevent backtracking,83 providing an elegant mechanistic rationale for the function of rG4 structures—which are among the most stable RNA secondary structures—in mRNA expression. We predict that the interplay and competition of RBPs stabilizing or melting rG4 structures during transcription will profoundly affect the transcriptional output from rG4-containing pre-mRNA transcripts. PKM2 and HNRNPF may just be paradigmatic examples of such factors, highlighting the need to completely map the complement of RBPs interacting with PRG4Ss in the nucleus in different tissues and during development.
Folded rG4 are gene regulatory elements in pre-mRNA.
Our study sheds light on the widely debated function of rG4s and highlights their role as cis-regulatory elements controlling gene expression. Previous systems-wide studies found that rG4 structures are globally unfolded in the cytoplasm due to the action of a highly redundant machinery of RBPs and helicases that either prevent their formation or unwind them.40,51,52,55 Knockout of these factors and concomitant rG4 formation in the cytoplasm is typically detrimental to the cell, e.g. by interfering with translation initiation or elongation34,52, or rG4 self-aggregation resulting in the activation of stress response pathways.51,84 However, rG4 sequences in the vertebrate transcriptome are deeply conserved,54,85 suggesting their regulatory role. We show that PKM2 allows co-transcriptional folding of rG4 elements leading to transcriptome-wide changes in gene expression. Considering that rG4 containing transcripts including PKM2 targets are enriched among transcripts required for the migratory phenotype in cancer cells, the rG4 elements may be considered as a clear example of a ‘regulon’86,87 that allows for the coordinated regulation of these transcripts. PKM2 may cooperate or compete with other nuclear rG4-binding RBPs for the regulation of these mRNAs. Consistent with this idea we showed that overexpression of HNRNPF, which binds unfolded rG4 sequences, has the opposite effect of PKM2. Intriguingly, HNRNPF expression suppresses the EMT,77 in contrast to nuclear PKM2, which promotes the expression of EMT associated genes.
PKM2-rG4 interaction as a therapeutic intervention point.
While PKM2 expression and activity has been well documented in many types of cancer, investigations with PKM2 knockout mice have challenged the role of PKM2 in tumorigenesis. PKM2 isoform-specific deletion showed no effect or enhanced tumor formation in breast88, colorectal89 and liver cancer.90,91 Nevertheless, it is evident that pharmacological activation or inhibition of PKM2 might serve as a platform to target tumor cells by altering their metabolism.10,88 In addition, in a mouse embryonic fibroblast oncogenic system, PKM1 expression is consistent with enhanced tumor growth, driven by a cell-autonomous mechanism of glycolytic control that is not documented for PKM2.92 These studies have uncovered a nuanced role for pyruvate kinase activity via both PKM1/2. Furthermore, other work suggests that cell-type and context may be important for the role of PKM2 controlling cell proliferation and tumor growth.7,90,93 Our study interrogates the effects of non-metabolic function of nuclear PKM2 in the context of tumor progression without connecting PKM2 function to tumor etiology. We restricted PKM2 from the nucleus (PKM2-NES) to resemble acute changes related to PKM2 RNA-binding function without disrupting PKM2 metabolic activity. Accordingly, we did not observe changes in the enzymatic activity of our PKM2-NES, but rather showed a change in the rG4ome across multiple cell lines. Importantly, our genetically modified PKM2-NES cells show striking changes with respect to their capacity of metastatic seeding in an aggressive breast cancer xenograft model. Our results point to nuclear regulation of rG4 transcripts as a possible mechanism for the integration of metabolic and signaling inputs that could control metastasis.
We propose that the PKM2-rG4 interaction may be the key to understanding the tumorigenic activity of nuclear PKM2. Disruption of this interaction could represent a therapeutic vulnerability to target migratory cell phenotypes, which coordinate tumorigenesis and metastasis. PKM2-rG4 interactions could be manipulated in multiple ways, e.g.: 1.) by influencing PKM splicing patterns using oligoribonucleotide inhibitors suppressing exon 10 inclusion, as prominently used to correct SMN splicing,94 2.) prevention of PKM2 nuclear translocation, e.g., stabilization of the cytoplasmic form,10 or interference with PKM2 phosphorylation,13 or 3.) structure-guided targeting of the, yet to be determined, PKM2-rG4 interaction surface.
Limitations of the Study
A major limitation of our study is the subtlety of the observed differences in the RNA-Seq and ChIP-Seq upon manipulation of nuclear PKM2 levels. On average, we saw changes of ~10% on mRNA levels for the top 200 PKM2 targets upon depletion of PKM2 from the nucleus in HEK293 levels, complicating validation of downstream protein expression changes. Nevertheless, the consistency between the ChIP-seq and RNA-seq data supports our interpretation that the regulation occurs at the transcriptional level. Furthermore, we found that in vitro, PKM2 binds DNA as well as RNA G4 structures in vitro. While G4s in promotor elements and in the template strand of gene bodies do not show any sensitivity to changes of nuclear PKM2 levels, we cannot fully rule out that DNA G4 elements in the coding strand and other G4s such as those at telomeres may be regulated by PKM2. Finally, while the correlation of rG4ome levels with poor patient prognosis in various cancers from TCGA is suggestive, further statistical analysis and experimental evidence needs to be collected before the rG4ome can be unambiguously nominated as a general cancer driver.
STAR Methods
Resource Availability
Lead Contact
Requests for resources and reagents and further information should be directed to and will be fulfilled by the lead contact, Dr. Markus Hafner (markus.hafner@nih.gov).
Materials Availability
All unique/stable reagents generated in this study are available from the lead contact with a completed Materials Transfer Agreement.
Data and Code Availability
Data produced within this study are publicly available as of the date of publication from the Gene Expression Omnibus (GEO) under the accession number GSE179817. This paper analyzes existing, publicly available data. The accession numbers for the datasets are listed in the key resources table.
Key Resources Table.
| REAGENT or RESOURCE | SOURCE | IDENTIFIER |
|---|---|---|
| Antibodies | ||
| Anti-FLAG M2 Magnetic Beads | Sigma-Aldrich | M8823 |
| Anti-FLAG M2 antibody | Sigma-Aldrich | F3165 |
| Alexa Fluor 488 Secondary Antibody | Thermo Fisher Scientific | A-11034 |
| Alexa Fluor 594 Secondary Antibody | Thermo Fisher Scientific | A-11032 |
| Anti-HNRNPF Antibody | hpa069667 | |
| Anti-PKM2 (D78A4) | Cell Signaling | 4053 |
| Anti-PKM | Abcam | ab150377 |
| Anti-RNA polymerase II CTD repeat YSPTSPS antibody - ChIP Grade | Abcam | ab26721 |
| Anti-RNA polymerase II CTD repeat YSPTSPS (phospho S2) antibody | Abcam | (ab5095) |
| Anti-RNA polymerase II CTD repeat YSPTSPS (phospho S5) antibody | Abcam | (ab5131) |
| GAPDH | ProteinTech | 10494-1-AP |
| Bacterial and virus strains | ||
| E. coli BL21 | NEB | C2527H |
| E. coli C321.ΔA | Addgene | 48998 |
| E. coli 5-alpha | NEB | C2987H |
| Chemicals, peptides, and recombinant proteins | ||
| 4-Thiouridine | BIOSYNTH | NT06186 |
| ATP Solution (100 mM) | Thermo | R0441 |
| Blasticidin S | Gibco | A1113903 |
| Blasticidin S HCl | Gibco | A1113903 |
| Chloroform:Isoamyl alcohol 24:1 | Sigma | C0549-1PT |
| cOmplete Protease Inhibitor Cocktail | Roche | 1.1697E+10 |
| Deoxynucleotide (dNTP) Solution Mix | NEB | 10966034 |
| DMEM, high glucose | Gibco | 11965092 |
| Dynabeads Protein G for Immunoprecipitation | Invitrogen | 10004D |
| EMEM | ATCC | 30-2003 |
| Fetal Bovine Serum | GeminiBio | 100-800 |
| FLAG Peptide | Sigma | F3290 |
| Gateway BP Clonase II Enzyme mix | Invitrogen | 11789020 |
| Gateway LR Clonase II Enzyme mix | Invitrogen | 11791020 |
| GlycoBlue Coprecipitant | Thermo Fisher Scientific | AM9515 |
| HisPur™ Ni-NTA Magnetic Beads | Thermo Scientific | 88831 |
| Hygromycin B | Gibco | 10687010 |
| Insulin solution from bovine pancreas | Sigma | I0516 |
| IPTG | MP Biomedicals | 02102101-CF |
| Lipofectamine 3000 | Invitrogen | L3000001 |
| Lipofectamine RNAiMAX | Invitrogen | 13778075 |
| Opti-MEM I Reduced Serum Medium | Gibco | 31985070 |
| PageRuler Plus, Prestained Protein Ladder | Thermo Fisher Scientific | 26620 |
| Penicillin-Streptomycin | Gibco | 15140163 |
| Platinum Taq DNA polymerase | Thermo Fisher Scientific | 10966034 |
| Proteinase K | Millipore Sigma | 3115879001 |
| Puromycin Dihydrochloride | Gibco | A1113803 |
| Quick CIP | NEB | M0525S |
| RNase I | Thermo Fischer Scientific | AM2294 |
| RNase T1 | Thermo Fischer Scientific | EN0542 |
| Rnl1 T4 RNA ligase | Thermo Fischer Scientific | EL0021 |
| SUPERase•In RNase inhibitor | Thermo Fisher Scientific | AM2694 |
| Superscript IV | Thermo Fisher Scientific | 18090010 |
| T4 PNK | NEB | M0201S |
| Critical commercial assays | ||
| EnzyChrom Pyruvate Kinase Assay Kit | Bio Assay Systems | EPRK-100 |
| EnzyLight ATP Assay kit | Bio Assay Systems | EATP-100 |
| Deposited data | ||
| RNA-Seq | This study | GSE179817 |
| PARCLIP | This study | GSE179817 |
| RBNS | This study | GSE179817 |
| CHIP-Seq | This study | GSE179817 |
| Normalized TCGA expression data | TCGA | GSE62944 |
| Hybrid E/M state breast cancer cells | Kröger et al.76 | GSE119149 |
| Experimental models: Cell lines | ||
| HEK293 T-Rex Flp-In | Thermo Fisher Scientific | R78007 |
| MCF-7 | ATCC | HTB-22 |
| MDA-MB-231 | ATCC | HTB-26 |
| 293T/17 [HEK 293T/17] | ATCC | CRL-11268 |
| Experimental models: Organisms/strains | ||
| NOD scid gamma (NSG) mice | The Jackson Laboratory | 005557 |
| Oligonucleotides | ||
| DsPKM 3’UTR | IDT | hs.Ri.PKM.13.3 |
| DsSCRAMBLE | IDT | 51-01-14-03 |
| Plasmids | ||
| pOG44 Flp-Recombinase Expression Vector | Invitrogen | V600520 |
| pLKO.1 | Addgene | 8453 |
| pFRT_TO_DESTFLAGHA | Addgene | 26361 |
| pMDLg/pRRE | Addgene | 12251 |
| pRSV-Rev | Addgene | 12253 |
| pMD2.G | Addgene | 12259 |
| pET-28a-hPKM1 | Addgene | 44241 |
| pET-28a-hPKM2 | Addgene | 44242 |
| pCRT7 NT Topo | Addgene | 73446 |
| SepOTSA | Addgene | 68292 |
| Software and algorithms | ||
| ImageJ | Fiji | SCR_002285 |
| GraphPad Prism | GraphPad | https://www.graphpad.com/ |
| ChimeraX | Petterson et al.95 | http://plato.cgl.ucsf.edu/chimerax/download.html |
| Samtools Version: 1.9 | Li et al.96 | https://samtools.sourceforge.net/ |
| PyMOL | Schrödinger | https://www.pymol.org |
| Cutadapt v2.4 | Martin97 | https://github.com/marcelm/cutadapt |
| STAR v2.7.2b | Dobin et al.98 | https://github.com/alexdobin/STAR |
| Other | ||
| Slide-A-Lyzer™ Dialysis Cassette, 10K MWCO | Thermo Fisher Scientific | 66380 |
| Pierce™ Protein Concentrators PES | Thermo Fisher Scientific | 88513 |
| Ni-charged MagBeads | GenScript | L00295 |
This paper does not report any original code.
Any additional information required to reanalyze the data reported in this paper is available from the lead contact upon request.
Experimental Model and Study Participant Details
Mouse model
Animal studies were performed in accordance with protocols approved by the Animal Care and Use Committee (ACUC) of the National Institute of Arthritis and Musculoskeletal and Skin Diseases (NIAMS). Six-week-old female NOD scid gamma (NSG) mice were obtained from The Jackson Laboratory and housed at NIAMS animal facilities with standard chow and water provided ad libitum. Mice were subcutaneously injected (23G needle; Med-Plus, Inc., Edison, NJ) with 107 cells of either parental MDA-MB231 (n = 5), heterozygous FH-NES-PKM/WT (n = 5), or homozygous FH-NES-PKM (n = 10) cells in 50% Matrigel (Corning, Corning, NY)/50% PBS in a total volume of 100 microliters. Tumor size was measured once per week. Study endpoints were body weight loss exceeding 20% or tumor size exceeding 15 mm in its largest diameter.
Cell culture
HEK293 T-Rex Flp-In cells (Thermo Fisher Scientific, Cat# R78007) were cultured in DMEM medium (Gibco) supplemented with 10% (v/v) fetal bovine serum (FBS), 100 μg/ml zeocin, and 10 μg/ml blasticidin (Gibco). MCF-7 cells were obtained from ATCC (Cat# HTB-22) and cultured in the recommended EMEM medium (ATCC) supplemented with 10% (v/v) FBS and 0.01 mg/ml bovine insulin (Sigma). MDA-MB-231 cells were obtained from ATCC (Cat# HTB-26) and cultured in DMEM-high glucose (Gibco) supplemented with 10% (v/v) FBS.
Method details
Plasmid transfection and mRNA knockdown
pFRT/TO-FLAG/HA-PKM2 and pFRT/TO-FLAG/HA-PKM2-NLS and -NES plasmids were generated as described previously99. Plasmids were transfected in cells together with pOG44 plasmid expressing Flp-recombinase (Invitrogen) using Lipofectamine 2000 transfection reagent (Invitrogen) according to manufacturer’s instructions to create stable HEK293 T-Rex Flp-In cells that conditionally express (doxycycline inducible) either wild-type Flag-HA-tagged PKM2 or Flag-HA-tagged PKM2-NES/-NLS fusions. Stable cell lines were maintained under selection using 10 μg/ml blasticidin and 50 μg/ml hygromycin B (Gibco).
Knockdown of PKM2 in MCF-7 cell lines was performed by lentiviral transduction. pLKO.1 (Addgene #84530) and 3rd generation lentiviral vectors were obtained from Addgene (#12251, #12253, #12259). shRNAs targeting the PKM 3’ UTR and control scramble shRNA were designed and cloned into pLKO.1 plasmid. Lentiviral and expression plasmids were co-transfected (1:1 ratio) into HEK293T/17 cells (ATCC) using Lipofectamine 3000 transfection reagent (Invitrogen) according to manufacturer’s instructions. The viral containing supernatant were collected 24 and 48 hours after transfection, filtered, and used to infect MCF-7 cells in the presence of 10 μg/ml polybrene. Infected cells were cultured for 9 days with 2 μg/ml puromycin (Gibco). Silencing of endogenous PKM in cells expressing PKM2-NES was performed using siRNA targeting 3’UTR of PKM (IDT hs.Ri.PKM.13.3) or scramble control (IDT, 51-01-14-03) using Lipofectamine™ RNAiMAX Transfection Reagent.
shPKM DNA oligomers:
5’-CCGGCAACGCTTGTAGAACTCACTCCTCGAGGAGTGAGTTCTACAAGCGTTGTTTTTG
5’-AATTCAAAAACAACGCTTGTAGAACTCACTCCTCGAGGAGTGAGTTCTACAAGCGTTG
Scramble-shRNA DNA oligomers:
5’-CCGGCCTAAGGTTAAGTCGCCCTCGCTCGAGCGAGGGCGACTTAACCTTAGGTTTTTG
5’-AATTCAAAAACCTAAGGTTAAGTCGCCCTCGCTCGAGCGAGGGCGACTTAACCTTAGG
fPAR-CLIP
Fluorescent Photoactivatable ribonucleoside-enhanced crosslinking and immunoprecipitation (fPAR-CLIP) was performed as described in68 with several modifications. For Doxycycline induced expression in HEK293 cells, 10 × 15 cm plates at 70% confluency cells conditionally expressing the wild-type PKM2/HNRNPF were induced with doxycycline for 24 hours followed by 100 μM 4-thiouridine treatment for 12 hours and UV crosslinked at 365 nm (300 mJ/cm2). The cytoplasm was extracted by resuspending cells in a modified hypotonic lysis buffer (10 mM Tris-HCl pH 7.5, 50 mM NaCl, 3 mM MgCl2, 0.1% NP-40, 10% glycerol) for 2 min. The nuclear pellet was washed twice with the same buffer and lysed in NP-40 buffer, followed by sonication. Proteins were immunoprecipitated using the anti-Flag M2 magnetic beads (Sigma). For fPAR-CLIPs of FH-PKM2 from HEK293 cells, after FLAG-IP, the RNPs were dephosphorylated, phosphorylated and a 5’ fluorescent DNA adapter modified with a 5’ IRDye® 800CW and four degenerate nucleotides that serve as unique molecular identifiers at the 3’ end (IR800-GTTCAGAGTTCTACAGTCCGACGATCrNrNrNrN). After SDS-PAGE analysis the fluorescent bands corresponding to the RNP-adapter were isolated, shredded, and treated with proteinase K as described in68. 3’ adapter (NNTAGTCGTGGAATTCTCGGGTGCCAAGG for cytoplasm and NNAGTGTCTGGAATTCTCGGGTGCCAAGG for nuclear) ligation was then performed on the recovered RNA footprint. For all other fPAR-CLIPs a 3’ fluorescent adapter (5’-rAppNNTGACTGTGGAATTCTCGGGT(AF647)GCCAAGG-(AF647)) was first ligated following IP and dephosphorylation. After SDS-PAGE analysis and proteinase K digestion phosphorylation was performed and a 5’ adapter was ligated (5’(aminolinker)-GTTCAGAGTTCTACAGTCCGACGATCrNrNrNrN). cDNA was synthesized using RT primer. A Low cycle PCR was performed using Platinum Taq DNA polymerase (Thermo Fiscer Scientific, 10966034), a short 5’ PCR (CTTCAGAGTTCTACAGTCCGACGA) primer and the RT primer according to manufacturer’s instruction. PCR products were size selected, for a range of 78–98 bp, on a 3% agarose gel (3% Pippin gel cassettes, Sage Science, CSD3010). A pilot PCR using as template 25% of the first low cycle and short primer PCR with 5’ long PCR primer: AATGATACGGCGACCACCGAGATCTACACGTTCAGAGTTCTACAGTCCGA and 3’ RNA PCR primer index: CAAGCAGAAGACGGCATACGAGAT-( 6 or 8 base index)-GTGACTGGAGTTCCTTGGCACCCGAGAATTCCA. After 8 cycles, 15 μl of product was removed every two cycles (8, 10, 12, …, 18 cycles). Products were visualized on a 2.5% agarose gel. The lowest cycle number with visible amount of product was chosen for a final large-scale PCR (30 μl of size selected in 300 μl total) with the same primers. The PCR products were cleaned and concentrated using DNA Clean & Concentrator kit (Zymo Research, D4013) and size selected (~140–170 bp) to remove primers and adapter-adapter byproducts using a 3% agarose gel (3% Pippin Prep). Quality of the final library was assessed using TapeStation system (Agilent). Sequencing was performed on an Illumina HiSeq 3000 or NovaSeq 6000 platform.
Recombinant protein expression and purification
To express recombinant PKM1 and PKM2 proteins, pET-28a-hPKM1 (Addgene #44241) and pET-28a-hPKM2 (Addgene #44242) were transformed into E. coli BL21(DE3) cells. 0.4 L of LB cultures were induced with 0.5 mM IPTG at an OD600 of 0.5 and incubated for an additional 5–7 hours at RT. Cell pellets were resuspended in 8 ml lysis buffer (300 mM NaCl, 50mM Tris-HCl pH 7.5, and 1% NP40), 20 mM imidazole, 1 mM DTT, and protease inhibitor cocktail (cOmplete, Roche). 0.5 ml of HisPur™ Ni-NTA Magnetic Beads (Thermo Fisher Scientific), equilibrated in the same buffer, were incubated with the lysate for 1 hour at 4°C under rotation and washed three times with 10 ml wash buffer (600 mM NaCl, 50mM Tris-HCl pH 7.5, 1% NP40, 30 mM Imidazole). Proteins were eluted with 1.5 ml elution buffer (300 mM NaCl, 50 mM Tris-HCl pH 7.5, 1% NP40 and 180 mM imidazole). Purified proteins were dialyzed into storage buffer (50 mM Tris-HCl pH 7.5, 300 mM NaCl) using Slide-A-Lyzer™ Dialysis Cassette, 10K MWCO, 3 ml (Thermo Fisher Scientific, Cat# 66380) and concentrated using Protein Concentrators PES, 10K MWCO, 0.5 ml (Thermo Fisher Scientific, Cat# 88513).
Phosphoprotein synthesis and purification
Plasmids and strains.
DNA sequences encoding the full-length N-term 6xHis-tagged Human PKM2 including a S37STOP(TAG) mutation was assembled into pCRT7/NT-TOPO bacterial expression plasmid (Addgene #73446) at NdeI/SacI cloning sites, respectively. pCRT7/NT-TOPO (Addgene #68306) was transformed into genomically recoded E. coli (C321.ΔA) cells along with SepOTSλ plasmid for phosphoprotein production (Addgene #68292)100,101.
Expression and purification.
Expression and purification of the full-length PKM2pS37 protein was performed as described before with modifications102. In brief, expression was induced with 0.2% arabinose at an OD600 of 0.8–0.9 for 20 hours at 30°C. Bacterial cells were lysed in 20 mM Tris-HCl pH 7.2, 500 mM NaCl, 1 mM Tris (2-carboxyethyl) phosphine (TCEP), 50 mM NaF, 1 mM NaVO4 buffer supplemented with 1 mg/ml lysozyme (Sigma), and protease inhibitor (cOmplete, Roche). Recombinant protein was purified on a HisTrap HP column (GE Healthcare) using continuous imidazole gradient (10–500 mM), followed by size exclusion chromatography on a Superdex 200 10/300 GL (GE Healthcare) with 20 mM Tris-HCl pH 7.2, 100 mM NaCl buffer containing 0.5 mM DTT, and 5% glycerol. Purified proteins were buffer exchanged into 50 mM Tris-HCl pH 7.4, 150 mM NaCl, and 20% glycerol for storage at −20°C.
Immunofluorescence analysis
Seven to 8 × 10⁴ cells were seeded in ibiTreat chamber slides (Ibidi). After 20–24 hours, cells were fixed with 4% PFA for 15 min at room temperature, washed three times with 1x DPBS, permeabilized with 0.1% Triton X-100 for 15 min and blocked with 10% goat serum (constituted in 0.1% Triton X-100) at room temperature. Cells were stained overnight at 4°C with primary antibodies against PKM2pS37 (rabbit polyclonal, custom-made) and total PKM2 (Cell Signaling Technology, Cat# 4053) a 1:200 and 1:100 dilution in blocking solution, respectively, or FLAG antibody (Sigma-Aldrich, Cat# F3165) (1:200 dilution) followed by incubation with secondary antibodies (1:300 dilution) conjugated with Alexa Fluor 488 (Thermo Fisher Scientific, Cat# A-11034) or Alexa Fluor 594 (Thermo Fisher Scientific, Cat# A-11032) and Hoechst 33342 (Invitrogen) labeling. All samples were imaged by confocal microscopy on a Leica Laser Scanning SP8 Microscope (20x or 63x oil objective) at room temperature using the same settings. Images were analyzed using ImageJ software (Fiji, RRID: SCR_002285). Fluorescence intensity was determined using manual masking and identical brightness and contrast parameters.
Electromobility Shift Assay (EMSA)
For Electromobility Shift Assays (EMSA) 6xHis-tagged proteins were incubated in increasing concentrations with 15 nM of Cy-5 fluorescent oligonucleotide in binding buffer (25 mM Tris-HCl pH 7.5, 100 mM KCl, 3 mM MgCl2, 0.01% tween, 1 mg/ml BSA, and 1 mM DTT) adjusted with water to a final volume of 40 μl. After incubation for 30 min at room temperature 10 μl of 50% glycerol was added and reactions were separated on a 0.6% agarose gel (running buffer 1x TBE, 25 mM KCl) at 80 V for 90 min at room temperature.
Bind-n-Seq Assay
Bind-n-Seq analysis was performed as described previously with a few modifications56. Five micrograms of 6x His-tagged PKM2 protein was bound to 25 μl Ni-Charged MagBeads (GenScript, L00295), washed, and incubated with 1 μM synthetic, completely randomized 29-nt long oligoribonucleotides (IDT) in binding buffer (25 mM Tris-HCl pH 7.5, 100 mM KCl, 3 mM MgCl2, 0.01% Tween, 1 mg/ml BSA, and 1 mM DTT) for 30 min at room temperature. Beads were washed once with binding buffer and RNA and proteins eluted with 10 mM Tris pH 7.0, 1 mM EDTA, 1% SDS. Eluted RNA was purified using the Oligo Clean & Concentrator kit according to manufacturer’s instructions (Zymo Research) and a 3’ adapter was ligated using T4 RNA Ligase 2, truncated (NEB) following manufacturer’s instructions. The reaction was cleaned and a 5’ adapter was ligated using T4 RNA Ligase (Ambion, Thermo Fisher Scientific), followed by reverse transcription using SuperScript IV Reverse Transcriptase and RT primer (GCCTTGGCACCCGAGAATTCCA) and PCR amplified using Platinum™ Taq DNA Polymerase and Illumina RNA PCR primers.
RNA Sequencing
RNA from cells was isolated using the Direct-zol RNA Miniprep Kit (Zymo Research, Cat# R2050) according to the manufacturer’s instructions. One microgram total RNA was Ribosomal RNA depleted using the NEBNext® rRNA Depletion Kit and cDNA libraries were prepared using the NEBNext® Ultra™ Directional RNA Library Prep Kit for Illumina® (NEB). cDNA libraries were sequenced on the Illumina HiSeq 3000 HiSeq X or NovaSeq 6000 platform. Reads were aligned to human genome version hg38 using STAR (star/2.7.2b)103. Cufflinks was used for differential expression104. All gene set files were obtained from GSEA website (www.broadinstitute.org/gsea). GSEA was performed using the GSEA v4.1.0 software. GO enrichment analysis was performed using the ShinyGO v0.66 tool105.
ChIP-Seq
ChIP-seq was performed following abcam protocols. Two by 15 cm plates of HEK293 T-Rex FH-PKM2-NLS (Treated with Doxycycline or DMSO for 72 hours) were crosslinked with 0.75% (Alfa Aesar 43368) for 10 min followed by 5 min treatment with 125 mM Glycine. Cells were washed and collected with PBS and lysed with 0.5 ml of lysis buffer (50 mM HEPES-KOH pH7.5, 140 mM NaCl, 1 mM EDTA pH8, 1% Triton X-100, 0.1% Sodium Deoxycholate, 0.1% SDS, and protease inhibitor cocktail [cOmplete, Roche]). After sonication using a bath sonicator (Bioruptor, diagenode) for 14 min (medium amplitude, 30 s on 30 s off) at 4°C. Next, 0.25 ml of lysate was diluted in RIPA buffer (50 mM Tris-HCl pH 8, 150 mM NaCl, 2 mM EDTA pH 8, 1% NP-40, 0.5% Sodium Deoxycholate, 0.1% SDS, and protease inhibitor cocktail) to a volume of 2 ml and IP was performed using 5 μg of anti-RNA polymerase II CTD repeat YSPTSPS antibody (Abcam, ab26721) or Anti-RNA polymerase II CTD repeat YSPTSPS (36hosphor-S2) (Abcam, ab5095) for 1 hour at 4°C. 30 μl of Protein G Dynabeads were equilibrated in the same buffer and added to the samples for 16 hours at 4°C under rotation. Beads were washed once with the following buffers. Low Salt Wash Buffer (0.1% SDS, 1% Triton X-100, 2 mM EDTA, 20 mM Tris-HCl pH 8.0, and 150 mM NaCl), High Salt Wash Buffer (0.1% SDS, 1% Triton X-100, 2 mM EDTA, 20 mM Tris-HCl pH 8.0, and 500 mM NaCl), LiCl Wash Buffer (0.25 M LiCl, 1% NP-40, 1% Sodium Deoxycholate, 1 mM EDTA, and 10 mM Tris-HCl pH 8.0). Elution was performed with 120 μl elution buffer at 30°C for 15 min with elution buffer (1% SDS and 100mM NaHCO3). Four and eight-tenths microliters of 5 M NaCl and 2 μl Rnase A/T1 (Thermo EN0551) were added to the eluent and incubated while shaking at 65°C overnight. Two microliters proteinase K (20 mg/mL) and incubate while shaking at 60°C for 1 h. Phenol/chloroform extraction was performed and the sample was cleaned and concentrated using the DNA Clean & Concentrator-5 kit Zymo Research, D013. Library for illumine sequencing was prepared using the NEBNext® Ultra™ II DNA Library Prep Kit for Illumina.
Matrigel invasion assays
Invasion assays were carried out as described previously using Biocoat Matrigel Invasion Chambers (BD Biosciences)13. Cells were serum starved for 6 hours and seeded on the chamber well inserts (5 × 10⁴ cells/insert). Cells were let to invade for 20–24 hours. Cells that did not invade were removed from the inner surface of the Matrigel chamber using a moistened cotton swab. The remaining, migrated cells were fixed directly on chamber by soaking in 4% PFA. After washing with 1× DPBS, membranes were stained with Hoechst 33342 (Invitrogen) and mounted on slides using ProLong Gold Antifade Mountant (Invitrogen). Imaging was performed using a Fluorescence Microscope (10× objective) and taken images (6–8 fields/membrane) were analyzed with ImageJ software.
Kinase activity assays
Pyruvate kinase reactions was performed under the following conditions: 30 mM Tris pH 7.4, 10 mM MgCl2, 0.6 mM PEP, and 1.5 mM ADP (final concentrations) with or without the presence of F1,6BP (70 μM). Reactions were assembled to final volume of 100 μl with the addition of Kinase-Glo Reagent (Promega) according to manufacturer’s instructions. The reactions were then initiated by adding the enzyme alone or in complex with equal amount (22 nM) of folded rG4 oligonucleotide (sequence derived from SLC7A5 3’UTR G4). ATP production was followed by measuring luminescence over time on a SpectraMax i3x plate reader (Molecular Devices). Measurements were converted to enzymatic units (μmol/min) and specific activities were calculated by normalizing to amount of protein (in mg).
TCGA analysis
Normalized TCGA expression data was downloaded from GEO GSE62944. The processed dataset file “GSM1536837_06_01_15_TCGA_24.tumor_Rsubread_FPKM.txt.gz” was used for further analyses. The genes were classified arbitrarily to G4-High and G4-Low if the number of rG4s were ≥ 4 and ≤ 2, respectively. Borderline genes (rG4 = 3) were omitted for better classification. Expression values for genes were log2 transformed. For each of the cancer samples (columns of TCGA dataset) means of expression for G4-High and G4-Low were calculated. Rank for the individual cancer samples (columns of TCGA data) were calculated by the ratio of the above-mentioned means by following formula: . Higher “rankValue” indicates have high expression values of genes with more than four rG4 per gene. For each of the 24 cancer subtypes a hyperparameter optimization cycle were carried out to find out the maximum survival differences among samples. To do so samples were stratified via percentiles of rankValue, i.e., samples with top 10% rankValue vs rest, top 20% rankValue vs rest, and so on. This systematic approach segregated the samples that has high expression values of genes with more than four rG4s that appeared to show low survivals compared to the rest.
Immunohistochemistry (IHC)
Slides were first deparaffinized in xylene and then hydrated through graded alcohols. Next, slides were subject to antigen retrieval in a Tris/EDTA buffer (pH 9). Slides were then blocked against endogenous peroxidases. Following blocking, slides were incubated with the primary antibody (Abcam ab205606, DDDDK) at a dilution of 1/1,350 (0.65ug/ml). The antibody was then detected with a goat-anti-rabbit HRP secondary and visualized with DAB (brown). Finally, the slides were counterstained with hematoxylin, dehydrated in graded alcohols, cleared in xylene, and mounted with permanent mounting media. All rinses were performed using either distilled water or TBST.
Quantification and Statistical Analysis
Statistical analyses was performed using GraphPad Prism software. Bar graphs were presented using mean values with error bars representing SD.
Supplementary Material
Lists of PAR-CLIP binding sites from 25 individual experiments for PKM1/2 and HNRNPF.
G4 sequence enrichment in publicly available PAR-CLIP data and from this paper.
Highlights.
Nuclear PKM2 binds folded RNA G4s on pre-mRNA.
G4 folding during transcription promotes mRNA expression.
G4 containing RNAs encode EMT components.
Nuclear PKM2 promotes lung metastasis.
Acknowledgments
The authors thank: members of the Hafner group, Michael Banco (NHLBI), Eugene Valkov (CCR/NCI) for discussions; Craig Thomas (NCATS) for providing TEPP-46; Faiza Naz and Stefania dell’Orso (NIAMS) for sequencing; Parthena Konstantinidou (NIDDK) and Davide Randazzo (NIAMS) for image acquisition; Patroula Nathanailidou (CCR/NCI) for image analysis; Dr. Svetlana Rogulina (Rinehart lab) for technical support; Joerg Nikolaus (Yale) for training on the use of equipment; the NHLBI Biophysics Core; Yolanda L. Jones (NIH Library) for editing assistance.
Funding
Intramural Research Programs of NIAMS (D.G.A., K.A.G., X.W., A.H.P, M.I.U., J.E.J, I.B., M.H.) and NIDDK (Q.C., A.D.H.); NIH/NCI U54 Grant #CA209992 (M.A., J.R.), and NIH/NIGMS R01 Grant #GM140481 (J.R.).
Footnotes
Declaration of Interests
J.R. is on the scientific advisory board and has an equity interest in Pearl Bio. J.R. is a co-founder and has an equity interest in Kapis Biosciences. The other authors declare no competing interests.
Publisher's Disclaimer: This is a PDF file of an unedited manuscript that has been accepted for publication. As a service to our customers we are providing this early version of the manuscript. The manuscript will undergo copyediting, typesetting, and review of the resulting proof before it is published in its final form. Please note that during the production process errors may be discovered which could affect the content, and all legal disclaimers that apply to the journal pertain.
References
- 1.Imamura K, and Tanaka T (1972). Multimolecular forms of pyruvate kinase from rat and other mammalian tissues. I. Electrophoretic studies. J Biochem 71, 1043–1051. 10.1093/oxfordjournals.jbchem.a129852. [DOI] [PubMed] [Google Scholar]
- 2.Vander Heiden MG, Cantley LC, and Thompson CB (2009). Understanding the Warburg effect: the metabolic requirements of cell proliferation. Science 324, 1029–1033. 10.1126/science.1160809. [DOI] [PMC free article] [PubMed] [Google Scholar]
- 3.Warburg O (1956). On the origin of cancer cells. Science 123, 309–314. 10.1126/science.123.3191.309. [DOI] [PubMed] [Google Scholar]
- 4.Christofk HR, Vander Heiden MG, Harris MH, Ramanathan A, Gerszten RE, Wei R, Fleming MD, Schreiber SL, and Cantley LC (2008). The M2 splice isoform of pyruvate kinase is important for cancer metabolism and tumour growth. Nature 452, 230–233. 10.1038/nature06734. [DOI] [PubMed] [Google Scholar]
- 5.Mazurek S, Boschek CB, Hugo F, and Eigenbrodt E (2005). Pyruvate kinase type M2 and its role in tumor growth and spreading. Semin Cancer Biol 15, 300–308. 10.1016/j.semcancer.2005.04.009. [DOI] [PubMed] [Google Scholar]
- 6.David CJ, Chen M, Assanah M, Canoll P, and Manley JL (2010). HnRNP proteins controlled by c-Myc deregulate pyruvate kinase mRNA splicing in cancer. Nature 463, 364–368. 10.1038/nature08697. [DOI] [PMC free article] [PubMed] [Google Scholar]
- 7.Dayton TL, Jacks T, and Vander Heiden MG (2016). PKM2, cancer metabolism, and the road ahead. EMBO Rep 17, 1721–1730. 10.15252/embr.201643300. [DOI] [PMC free article] [PubMed] [Google Scholar]
- 8.Wang C, Jiang J, Ji J, Cai Q, Chen X, Yu Y, Zhu Z, and Zhang J (2017). PKM2 promotes cell migration and inhibits autophagy by mediating PI3K/AKT activation and contributes to the malignant development of gastric cancer. Scientific Reports 7, 2886. 10.1038/s41598-017-03031-1. [DOI] [PMC free article] [PubMed] [Google Scholar]
- 9.Li C, Zhao Z, Zhou Z, and Liu R (2016). PKM2 Promotes Cell Survival and Invasion Under Metabolic Stress by Enhancing Warburg Effect in Pancreatic Ductal Adenocarcinoma. Digestive Diseases and Sciences 61, 767–773. 10.1007/s10620-015-3931-2. [DOI] [PubMed] [Google Scholar]
- 10.Anastasiou D, Yu Y, Israelsen WJ, Jiang JK, Boxer MB, Hong BS, Tempel W, Dimov S, Shen M, Jha A, et al. (2012). Pyruvate kinase M2 activators promote tetramer formation and suppress tumorigenesis. Nat Chem Biol 8, 839–847. 10.1038/nchembio.1060. [DOI] [PMC free article] [PubMed] [Google Scholar]
- 11.Yang W, and Lu Z (2013). Nuclear PKM2 regulates the Warburg effect. Cell Cycle 12, 3154–3158. 10.4161/cc.26182. [DOI] [PMC free article] [PubMed] [Google Scholar]
- 12.Yang W, Xia Y, Ji H, Zheng Y, Liang J, Huang W, Gao X, Aldape K, and Lu Z (2011). Nuclear PKM2 regulates β-catenin transactivation upon EGFR activation. Nature 480, 118–122. 10.1038/nature10598. [DOI] [PMC free article] [PubMed] [Google Scholar]
- 13.Apostolidi M, Vathiotis IA, Muthusamy V, Gaule P, Gassaway BM, Rimm DL, and Rinehart J (2021). Targeting Pyruvate Kinase M2 phosphorylation reverses aggressive cancer phenotypes. Cancer Res. 10.1158/0008-5472.Can-20-4190. [DOI] [PMC free article] [PubMed] [Google Scholar]
- 14.Yang W, Zheng Y, Xia Y, Ji H, Chen X, Guo F, Lyssiotis CA, Aldape K, Cantley LC, and Lu Z (2012). ERK1/2-dependent phosphorylation and nuclear translocation of PKM2 promotes the Warburg effect. Nat Cell Biol 14, 1295–1304. 10.1038/ncb2629. [DOI] [PMC free article] [PubMed] [Google Scholar]
- 15.Wang Y, Liu J, Jin X, Zhang D, Li D, Hao F, Feng Y, Gu S, Meng F, Tian M, et al. (2017). O-GlcNAcylation destabilizes the active tetrameric PKM2 to promote the Warburg effect. Proceedings of the National Academy of Sciences 114, 13732–13737. doi: 10.1073/pnas.1704145115. [DOI] [PMC free article] [PubMed] [Google Scholar]
- 16.Prakasam G, Iqbal MA, Bamezai RNK, and Mazurek S (2018). Posttranslational Modifications of Pyruvate Kinase M2: Tweaks that Benefit Cancer. Front Oncol 8, 22. 10.3389/fonc.2018.00022. [DOI] [PMC free article] [PubMed] [Google Scholar]
- 17.Tanaka F, Yoshimoto S, Okamura K, Ikebe T, and Hashimoto S (2018). Nuclear PKM2 promotes the progression of oral squamous cell carcinoma by inducing EMT and post-translationally repressing TGIF2. Oncotarget 9, 33745–33761. 10.18632/oncotarget.25850. [DOI] [PMC free article] [PubMed] [Google Scholar]
- 18.Hamabe A, Konno M, Tanuma N, Shima H, Tsunekuni K, Kawamoto K, Nishida N, Koseki J, Mimori K, Gotoh N, et al. (2014). Role of pyruvate kinase M2 in transcriptional regulation leading to epithelial-mesenchymal transition. Proc Natl Acad Sci U S A 111, 15526–15531. 10.1073/pnas.1407717111. [DOI] [PMC free article] [PubMed] [Google Scholar]
- 19.Queiroz RML, Smith T, Villanueva E, Marti-Solano M, Monti M, Pizzinga M, Mirea DM, Ramakrishna M, Harvey RF, Dezi V, et al. (2019). Comprehensive identification of RNA-protein interactions in any organism using orthogonal organic phase separation (OOPS). Nat Biotechnol 37, 169–178. 10.1038/s41587-018-0001-2. [DOI] [PMC free article] [PubMed] [Google Scholar]
- 20.Simsek D, Tiu GC, Flynn RA, Byeon GW, Leppek K, Xu AF, Chang HY, and Barna M (2017). The Mammalian Ribo-interactome Reveals Ribosome Functional Diversity and Heterogeneity. Cell 169, 1051–1065.e1018. 10.1016/j.cell.2017.05.022. [DOI] [PMC free article] [PubMed] [Google Scholar]
- 21.Baltz AG, Munschauer M, Schwanhäusser B, Vasile A, Murakawa Y, Schueler M, Youngs N, Penfold-Brown D, Drew K, Milek M, et al. (2012). The mRNA-bound proteome and its global occupancy profile on protein-coding transcripts. Mol Cell 46, 674–690. 10.1016/j.molcel.2012.05.021. [DOI] [PubMed] [Google Scholar]
- 22.Castello A, Fischer B, Eichelbaum K, Horos R, Beckmann Benedikt M., Strein C, Davey Norman E., Humphreys David T., Preiss T, Steinmetz Lars M., et al. (2012). Insights into RNA Biology from an Atlas of Mammalian mRNA-Binding Proteins. Cell 149, 1393–1406. 10.1016/j.cell.2012.04.031. [DOI] [PubMed] [Google Scholar]
- 23.Perez-Perri JI, Rogell B, Schwarzl T, Stein F, Zhou Y, Rettel M, Brosig A, and Hentze MW (2018). Discovery of RNA-binding proteins and characterization of their dynamic responses by enhanced RNA interactome capture. Nat Commun 9, 4408. 10.1038/s41467-018-06557-8. [DOI] [PMC free article] [PubMed] [Google Scholar]
- 24.Hentze MW, Castello A, Schwarzl T, and Preiss T (2018). A brave new world of RNA-binding proteins. Nat Rev Mol Cell Biol 19, 327–341. 10.1038/nrm.2017.130. [DOI] [PubMed] [Google Scholar]
- 25.Castello A, Hentze MW, and Preiss T (2015). Metabolic Enzymes Enjoying New Partnerships as RNA-Binding Proteins. Trends Endocrinol Metab 26, 746–757. 10.1016/j.tem.2015.09.012. [DOI] [PMC free article] [PubMed] [Google Scholar]
- 26.Nagy E, and Rigby WF (1995). Glyceraldehyde-3-phosphate dehydrogenase selectively binds AU-rich RNA in the NAD(+)-binding region (Rossmann fold). J Biol Chem 270, 2755–2763. 10.1074/jbc.270.6.2755. [DOI] [PubMed] [Google Scholar]
- 27.Huppertz I, Perez-Perri JI, Mantas P, Sekaran T, Schwarzl T, Russo F, Ferring-Appel D, Koskova Z, Dimitrova-Paternoga L, Kafkia E, et al. (2022). Riboregulation of Enolase 1 activity controls glycolysis and embryonic stem cell differentiation. Mol Cell. 10.1016/j.molcel.2022.05.019. [DOI] [PubMed] [Google Scholar]
- 28.Hentze MW, Caughman SW, Rouault TA, Barriocanal JG, Dancis A, Harford JB, and Klausner RD (1987). Identification of the iron-responsive element for the translational regulation of human ferritin mRNA. Science 238, 1570–1573. 10.1126/science.3685996. [DOI] [PubMed] [Google Scholar]
- 29.Sen D, and Gilbert W (1988). Formation of parallel four-stranded complexes by guanine-rich motifs in DNA and its implications for meiosis. Nature 334, 364–366. 10.1038/334364a0. [DOI] [PubMed] [Google Scholar]
- 30.Bevilacqua PC, Ritchey LE, Su Z, and Assmann SM (2016). Genome-Wide Analysis of RNA Secondary Structure. Annu Rev Genet 50, 235–266. 10.1146/annurev-genet-120215-035034. [DOI] [PubMed] [Google Scholar]
- 31.Gellert M, Lipsett MN, and Davies DR (1962). Helix formation by guanylic acid. Proc Natl Acad Sci U S A 48, 2013–2018. 10.1073/pnas.48.12.2013. [DOI] [PMC free article] [PubMed] [Google Scholar]
- 32.Millevoi S, Moine H, and Vagner S (2012). G-quadruplexes in RNA biology. Wiley Interdiscip Rev RNA 3, 495–507. 10.1002/wrna.1113. [DOI] [PubMed] [Google Scholar]
- 33.Bugaut A, and Balasubramanian S (2012). 5’-UTR RNA G-quadruplexes: translation regulation and targeting. Nucleic Acids Res 40, 4727–4741. 10.1093/nar/gks068. [DOI] [PMC free article] [PubMed] [Google Scholar]
- 34.Wolfe AL, Singh K, Zhong Y, Drewe P, Rajasekhar VK, Sanghvi VR, Mavrakis KJ, Jiang M, Roderick JE, Van der Meulen J, et al. (2014). RNA G-quadruplexes cause eIF4A-dependent oncogene translation in cancer. Nature 513, 65–70. 10.1038/nature13485. [DOI] [PMC free article] [PubMed] [Google Scholar]
- 35.Fay MM, Lyons SM, and Ivanov P (2017). RNA G-Quadruplexes in Biology: Principles and Molecular Mechanisms. J Mol Biol 429, 2127–2147. 10.1016/j.jmb.2017.05.017. [DOI] [PMC free article] [PubMed] [Google Scholar]
- 36.Rouleau S, Jodoin R, Garant JM, and Perreault JP (2020). RNA G-Quadruplexes as Key Motifs of the Transcriptome. Adv Biochem Eng Biotechnol 170, 1–20. 10.1007/10_2017_8. [DOI] [PubMed] [Google Scholar]
- 37.Haeusler AR, Donnelly CJ, Periz G, Simko EA, Shaw PG, Kim MS, Maragakis NJ, Troncoso JC, Pandey A, Sattler R, et al. (2014). C9orf72 nucleotide repeat structures initiate molecular cascades of disease. Nature 507, 195–200. 10.1038/nature13124. [DOI] [PMC free article] [PubMed] [Google Scholar]
- 38.Serikawa T, Spanos C, von Hacht A, Budisa N, Rappsilber J, and Kurreck J (2018). Comprehensive identification of proteins binding to RNA G-quadruplex motifs in the 5’ UTR of tumor-associated mRNAs. Biochimie 144, 169–184. 10.1016/j.biochi.2017.11.003. [DOI] [PubMed] [Google Scholar]
- 39.Huppert JL, Bugaut A, Kumari S, and Balasubramanian S (2008). G-quadruplexes: the beginning and end of UTRs. Nucleic Acids Res 36, 6260–6268. 10.1093/nar/gkn511. [DOI] [PMC free article] [PubMed] [Google Scholar]
- 40.Guo JU, and Bartel DP (2016). RNA G-quadruplexes are globally unfolded in eukaryotic cells and depleted in bacteria. Science 353, aaf5371. 10.1126/science.aaf5371. [DOI] [PMC free article] [PubMed] [Google Scholar]
- 41.Kwok CK, Marsico G, Sahakyan AB, Chambers VS, and Balasubramanian S (2016). rG4-seq reveals widespread formation of G-quadruplex structures in the human transcriptome. Nat Methods 13, 841–844. 10.1038/nmeth.3965. [DOI] [PubMed] [Google Scholar]
- 42.Rhodes D, and Lipps HJ (2015). G-quadruplexes and their regulatory roles in biology. Nucleic Acids Res 43, 8627–8637. 10.1093/nar/gkv862. [DOI] [PMC free article] [PubMed] [Google Scholar]
- 43.Rouleau SG, Garant JM, Bolduc F, Bisaillon M, and Perreault JP (2018). G-Quadruplexes influence pri-microRNA processing. RNA Biol 15, 198–206. 10.1080/15476286.2017.1405211. [DOI] [PMC free article] [PubMed] [Google Scholar]
- 44.Rouleau S, Glouzon JS, Brumwell A, Bisaillon M, and Perreault JP (2017). 3’ UTR G-quadruplexes regulate miRNA binding. RNA 23, 1172–1179. 10.1261/rna.060962.117. [DOI] [PMC free article] [PubMed] [Google Scholar]
- 45.Beaudoin JD, and Perreault JP (2013). Exploring mRNA 3’-UTR G-quadruplexes: evidence of roles in both alternative polyadenylation and mRNA shortening. Nucleic Acids Res 41, 5898–5911. 10.1093/nar/gkt265. [DOI] [PMC free article] [PubMed] [Google Scholar]
- 46.Kumari S, Bugaut A, Huppert JL, and Balasubramanian S (2007). An RNA G-quadruplex in the 5’ UTR of the NRAS proto-oncogene modulates translation. Nat Chem Biol 3, 218–221. 10.1038/nchembio864. [DOI] [PMC free article] [PubMed] [Google Scholar]
- 47.Arora A, Dutkiewicz M, Scaria V, Hariharan M, Maiti S, and Kurreck J (2008). Inhibition of translation in living eukaryotic cells by an RNA G-quadruplex motif. RNA 14, 1290–1296. 10.1261/rna.1001708. [DOI] [PMC free article] [PubMed] [Google Scholar]
- 48.Kwok CK, Marsico G, and Balasubramanian S (2018). Detecting RNA G-Quadruplexes (rG4s) in the Transcriptome. Cold Spring Harb Perspect Biol 10. 10.1101/cshperspect.a032284. [DOI] [PMC free article] [PubMed] [Google Scholar]
- 49.Biffi G, Di Antonio M, Tannahill D, and Balasubramanian S (2014). Visualization and selective chemical targeting of RNA G-quadruplex structures in the cytoplasm of human cells. Nat Chem 6, 75–80. 10.1038/nchem.1805. [DOI] [PMC free article] [PubMed] [Google Scholar]
- 50.Sauer M, and Paeschke K (2017). G-quadruplex unwinding helicases and their function in vivo. Biochem Soc Trans 45, 1173–1182. 10.1042/BST20170097. [DOI] [PubMed] [Google Scholar]
- 51.Sauer M, Juranek SA, Marks J, De Magis A, Kazemier HG, Hilbig D, Benhalevy D, Wang X, Hafner M, and Paeschke K (2019). DHX36 prevents the accumulation of translationally inactive mRNAs with G4-structures in untranslated regions. Nature Communications 10, 2421. 10.1038/s41467-019-10432-5. [DOI] [PMC free article] [PubMed] [Google Scholar]
- 52.Benhalevy D, Gupta SK, Danan CH, Ghosal S, Sun HW, Kazemier HG, Paeschke K, Hafner M, and Juranek SA (2017). The Human CCHC-type Zinc Finger Nucleic Acid-Binding Protein Binds G-Rich Elements in Target mRNA Coding Sequences and Promotes Translation. Cell Rep 18, 2979–2990. 10.1016/j.celrep.2017.02.080. [DOI] [PMC free article] [PubMed] [Google Scholar]
- 53.Vo T, Brownmiller T, Hall K, Jones TL, Choudhari S, Grammatikakis I, Ludwig KR, and Caplen NJ (2022). HNRNPH1 destabilizes the G-quadruplex structures formed by G-rich RNA sequences that regulate the alternative splicing of an oncogenic fusion transcript. Nucleic Acids Res 50, 6474–6496. 10.1093/nar/gkac409. [DOI] [PMC free article] [PubMed] [Google Scholar]
- 54.Lee DSM, Ghanem LR, and Barash Y (2020). Integrative analysis reveals RNA G-quadruplexes in UTRs are selectively constrained and enriched for functional associations. Nature Communications 11, 527. 10.1038/s41467-020-14404-y. [DOI] [PMC free article] [PubMed] [Google Scholar]
- 55.Zhang Y, Yang M, Duncan S, Yang X, Abdelhamid MAS, Huang L, Zhang H, Benfey PN, Waller ZAE, and Ding Y (2019). G-quadruplex structures trigger RNA phase separation. Nucleic Acids Research 47, 11746–11754. 10.1093/nar/gkz978. [DOI] [PMC free article] [PubMed] [Google Scholar]
- 56.Lambert N, Robertson A, Jangi M, McGeary S, Sharp PA, and Burge CB (2014). RNA Bind-n-Seq: quantitative assessment of the sequence and structural binding specificity of RNA binding proteins. Mol Cell 54, 887–900. 10.1016/j.molcel.2014.04.016. [DOI] [PMC free article] [PubMed] [Google Scholar]
- 57.Huppert JL, and Balasubramanian S (2005). Prevalence of quadruplexes in the human genome. Nucleic Acids Res 33, 2908–2916. 10.1093/nar/gki609. [DOI] [PMC free article] [PubMed] [Google Scholar]
- 58.Todd AK, Johnston M, and Neidle S (2005). Highly prevalent putative quadruplex sequence motifs in human DNA. Nucleic Acids Res 33, 2901–2907. 10.1093/nar/gki553. [DOI] [PMC free article] [PubMed] [Google Scholar]
- 59.Bhattacharyya D, Mirihana Arachchilage G, and Basu S (2016). Metal Cations in G-Quadruplex Folding and Stability. Front Chem 4, 38. 10.3389/fchem.2016.00038. [DOI] [PMC free article] [PubMed] [Google Scholar]
- 60.Chen MC, Tippana R, Demeshkina NA, Murat P, Balasubramanian S, Myong S, and Ferre-D’Amare AR (2018). Structural basis of G-quadruplex unfolding by the DEAH/RHA helicase DHX36. Nature 558, 465–469. 10.1038/s41586-018-0209-9. [DOI] [PMC free article] [PubMed] [Google Scholar]
- 61.Shao X, Zhang W, Umar MI, Wong HY, Seng Z, Xie Y, Zhang Y, Yang L, Kwok CK, and Deng X (2020). RNA G-Quadruplex Structures Mediate Gene Regulation in Bacteria. mBio 11, e02926–02919. 10.1128/mBio.02926-19. [DOI] [PMC free article] [PubMed] [Google Scholar]
- 62.He C, Sidoli S, Warneford-Thomson R, Tatomer DC, Wilusz JE, Garcia BA, and Bonasio R (2016). High-Resolution Mapping of RNA-Binding Regions in the Nuclear Proteome of Embryonic Stem Cells. Mol Cell 64, 416–430. 10.1016/j.molcel.2016.09.034. [DOI] [PMC free article] [PubMed] [Google Scholar]
- 63.Dominguez D, Freese P, Alexis MS, Su A, Hochman M, Palden T, Bazile C, Lambert NJ, Van Nostrand EL, Pratt GA, et al. (2018). Sequence, Structure, and Context Preferences of Human RNA Binding Proteins. Mol Cell 70, 854–867 e859. 10.1016/j.molcel.2018.05.001. [DOI] [PMC free article] [PubMed] [Google Scholar]
- 64.Dominguez C, and Allain FH-T (2006). NMR structure of the three quasi RNA recognition motifs (qRRMs) of human hnRNP F and interaction studies with Bcl-x G-tract RNA: a novel mode of RNA recognition. Nucleic Acids Research 34, 3634–3645. 10.1093/nar/gkl488. [DOI] [PMC free article] [PubMed] [Google Scholar]
- 65.Dominguez C, Fisette J-F, Chabot B, and Allain FHT (2010). Structural basis of G-tract recognition and encaging by hnRNP F quasi-RRMs. Nature Structural & Molecular Biology 17, 853–861. 10.1038/nsmb.1814. [DOI] [PubMed] [Google Scholar]
- 66.Samatanga B, Dominguez C, Jelesarov I, and Allain FH (2013). The high kinetic stability of a G-quadruplex limits hnRNP F qRRM3 binding to G-tract RNA. Nucleic Acids Res 41, 2505–2516. 10.1093/nar/gks1289. [DOI] [PMC free article] [PubMed] [Google Scholar]
- 67.Hafner M, Landthaler M, Burger L, Khorshid M, Hausser J, Berninger P, Rothballer A, Ascano M Jr., Jungkamp AC, Munschauer M, et al. (2010). Transcriptome-wide identification of RNA-binding protein and microRNA target sites by PAR-CLIP. Cell 141, 129–141. 10.1016/j.cell.2010.03.009. [DOI] [PMC free article] [PubMed] [Google Scholar]
- 68.Anastasakis DG, Jacob A, Konstantinidou P, Meguro K, Claypool D, Cekan P, Haase AD, and Hafner M (2021). A non-radioactive, improved PAR-CLIP and small RNA cDNA library preparation protocol. Nucleic Acids Res. 10.1093/nar/gkab011. [DOI] [PMC free article] [PubMed] [Google Scholar]
- 69.Licatalosi DD, Mele A, Fak JJ, Ule J, Kayikci M, Chi SW, Clark TA, Schweitzer AC, Blume JE, Wang X, et al. (2008). HITS-CLIP yields genome-wide insights into brain alternative RNA processing. Nature 456, 464–469. 10.1038/nature07488. [DOI] [PMC free article] [PubMed] [Google Scholar]
- 70.Corcoran DL, Georgiev S, Mukherjee N, Gottwein E, Skalsky RL, Keene JD, and Ohler U (2011). PARalyzer: definition of RNA binding sites from PAR-CLIP short-read sequence data. Genome Biol 12, R79. 10.1186/gb-2011-12-8-r79. [DOI] [PMC free article] [PubMed] [Google Scholar]
- 71.Ramirez F, Dundar F, Diehl S, Gruning BA, and Manke T (2014). deepTools: a flexible platform for exploring deep-sequencing data. Nucleic Acids Res 42, W187–191. 10.1093/nar/gku365. [DOI] [PMC free article] [PubMed] [Google Scholar]
- 72.Meng Q, Stoyko D, Andrews CM, Konstantinidou P, Genzor P,O,T, Elchert AR, Benner L, Sobti S, Katz EY, and Haase AD (2022). Functional editing of endogenous genes through rapid selection of cell pools (Rapid generation of endogenously tagged genes in Drosophila ovarian somatic sheath cells). Nucleic Acids Res 50, e90. 10.1093/nar/gkac448. [DOI] [PMC free article] [PubMed] [Google Scholar]
- 73.Huppert JL, and Balasubramanian S (2007). G-quadruplexes in promoters throughout the human genome. Nucleic acids research 35, 406–413. 10.1093/nar/gkl1057. [DOI] [PMC free article] [PubMed] [Google Scholar]
- 74.Gaidatzis D, Burger L, Florescu M, and Stadler MB (2015). Analysis of intronic and exonic reads in RNA-seq data characterizes transcriptional and post-transcriptional regulation. Nat Biotechnol 33, 722–729. 10.1038/nbt.3269. [DOI] [PubMed] [Google Scholar]
- 75.Subramanian A, Tamayo P, Mootha VK, Mukherjee S, Ebert BL, Gillette MA, Paulovich A, Pomeroy SL, Golub TR, Lander ES, and Mesirov JP (2005). Gene set enrichment analysis: A knowledge-based approach for interpreting genome-wide expression profiles. Proceedings of the National Academy of Sciences 102, 15545–15550. 10.1073/pnas.0506580102. [DOI] [PMC free article] [PubMed] [Google Scholar]
- 76.Kröger C, Afeyan A, Mraz J, Eaton EN, Reinhardt F, Khodor YL, Thiru P, Bierie B, Ye X, Burge CB, and Weinberg RA (2019). Acquisition of a hybrid E/M state is essential for tumorigenicity of basal breast cancer cells. Proc Natl Acad Sci U S A 116, 7353–7362. 10.1073/pnas.1812876116. [DOI] [PMC free article] [PubMed] [Google Scholar]
- 77.Huang H, Zhang J, Harvey SE, Hu X, and Cheng C (2017). RNA G-quadruplex secondary structure promotes alternative splicing via the RNA-binding protein hnRNPF. Genes Dev 31, 2296–2309. 10.1101/gad.305862.117. [DOI] [PMC free article] [PubMed] [Google Scholar]
- 78.Robinson JB Jr., and Srere PA (1985). Organization of Krebs tricarboxylic acid cycle enzymes in mitochondria. J Biol Chem 260, 10800–10805. [PubMed] [Google Scholar]
- 79.Long Y, Hwang T, Gooding AR, Goodrich KJ, Rinn JL, and Cech TR (2020). RNA is essential for PRC2 chromatin occupancy and function in human pluripotent stem cells. Nat Genet 52, 931–938. 10.1038/s41588-020-0662-x. [DOI] [PMC free article] [PubMed] [Google Scholar]
- 80.Song J, Gooding AR, Hemphill WO, Love BD, Robertson A, Yao L, Zon LI, North TE, Kasinath V, and Cech TR (2023). Structural basis for inactivation of PRC2 by G-quadruplex RNA. Science 381, 1331–1337. 10.1126/science.adh0059. [DOI] [PMC free article] [PubMed] [Google Scholar]
- 81.Damasceno LEA, Prado DS, Veras FP, Fonseca MM, Toller-Kawahisa JE, Rosa MH, Publio GA, Martins TV, Ramalho FS, Waisman A, et al. (2020). PKM2 promotes Th17 cell differentiation and autoimmune inflammation by fine-tuning STAT3 activation. J Exp Med 217. 10.1084/jem.20190613. [DOI] [PMC free article] [PubMed] [Google Scholar]
- 82.Jonkers I, and Lis JT (2015). Getting up to speed with transcription elongation by RNA polymerase II. Nat Rev Mol Cell Biol 16, 167–177. 10.1038/nrm3953. [DOI] [PMC free article] [PubMed] [Google Scholar]
- 83.Turowski TW, Petfalski E, Goddard BD, French SL, Helwak A, and Tollervey D (2020). Nascent Transcript Folding Plays a Major Role in Determining RNA Polymerase Elongation Rates. Mol Cell 79, 488–503 e411. 10.1016/j.molcel.2020.06.002. [DOI] [PMC free article] [PubMed] [Google Scholar]
- 84.Kharel P, Fay M, Manasova EV, Anderson PJ, Kurkin AV, Guo JU, and Ivanov P (2023). Stress promotes RNA G-quadruplex folding in human cells. Nat Commun 14, 205. 10.1038/s41467-023-35811-x. [DOI] [PMC free article] [PubMed] [Google Scholar]
- 85.Zhang Y, Yang M, Duncan S, Yang X, Abdelhamid MAS, Huang L, Zhang H, Benfey PN, Waller ZAE, and Ding Y (2019). G-quadruplex structures trigger RNA phase separation. Nucleic Acids Res 47, 11746–11754. 10.1093/nar/gkz978. [DOI] [PMC free article] [PubMed] [Google Scholar]
- 86.Keene JD (2007). RNA regulons: coordination of post-transcriptional events. Nat Rev Genet 8, 533–543. 10.1038/nrg2111. [DOI] [PubMed] [Google Scholar]
- 87.Mansfield KD, and Keene JD (2009). The ribonome: a dominant force in co-ordinating gene expression. Biol Cell 101, 169–181. 10.1042/BC20080055. [DOI] [PMC free article] [PubMed] [Google Scholar]
- 88.Israelsen WJ, Dayton TL, Davidson SM, Fiske BP, Hosios AM, Bellinger G, Li J, Yu Y, Sasaki M, Horner JW, et al. (2013). PKM2 isoform-specific deletion reveals a differential requirement for pyruvate kinase in tumor cells. Cell 155, 397–409. 10.1016/j.cell.2013.09.025. [DOI] [PMC free article] [PubMed] [Google Scholar]
- 89.Lau AN, Israelsen WJ, Roper J, Sinnamon MJ, Georgeon L, Dayton TL, Hillis AL, Yilmaz OH, Di Vizio D, Hung KE, and Vander Heiden MG (2017). PKM2 is not required for colon cancer initiated by APC loss. Cancer Metab 5, 10. 10.1186/s40170-017-0172-1. [DOI] [PMC free article] [PubMed] [Google Scholar]
- 90.Dayton TL, Gocheva V, Miller KM, Israelsen WJ, Bhutkar A, Clish CB, Davidson SM, Luengo A, Bronson RT, Jacks T, and Vander Heiden MG (2016). Germline loss of PKM2 promotes metabolic distress and hepatocellular carcinoma. Genes Dev 30, 1020–1033. 10.1101/gad.278549.116. [DOI] [PMC free article] [PubMed] [Google Scholar]
- 91.Méndez-Lucas A, Li X, Hu J, Che L, Song X, Jia J, Wang J, Xie C, Driscoll PC, Tschaharganeh DF, et al. (2017). Glucose Catabolism in Liver Tumors Induced by c-MYC Can Be Sustained by Various PKM1/PKM2 Ratios and Pyruvate Kinase Activities. Cancer Res 77, 4355–4364. 10.1158/0008-5472.Can-17-0498. [DOI] [PMC free article] [PubMed] [Google Scholar]
- 92.Morita M, Sato T, Nomura M, Sakamoto Y, Inoue Y, Tanaka R, Ito S, Kurosawa K, Yamaguchi K, Sugiura Y, et al. (2018). PKM1 Confers Metabolic Advantages and Promotes Cell-Autonomous Tumor Cell Growth. Cancer Cell 33, 355–367.e357. 10.1016/j.ccell.2018.02.004. [DOI] [PubMed] [Google Scholar]
- 93.Xia Y, Wang X, Liu Y, Shapiro E, Lepor H, Tang MS, Sun TT, and Wu XR (2022). PKM2 Is Essential for Bladder Cancer Growth and Maintenance. Cancer Res 82, 571–585. 10.1158/0008-5472.Can-21-0403. [DOI] [PMC free article] [PubMed] [Google Scholar]
- 94.Hua Y, Vickers TA, Okunola HL, Bennett CF, and Krainer AR (2008). Antisense masking of an hnRNP A1/A2 intronic splicing silencer corrects SMN2 splicing in transgenic mice. Am J Hum Genet 82, 834–848. 10.1016/j.ajhg.2008.01.014. [DOI] [PMC free article] [PubMed] [Google Scholar]
- 95.Pettersen EF, Goddard TD, Huang CC, Meng EC, Couch GS, Croll TI, Morris JH, and Ferrin TE (2021). UCSF ChimeraX: Structure visualization for researchers, educators, and developers. Protein Sci 30, 70–82. 10.1002/pro.3943. [DOI] [PMC free article] [PubMed] [Google Scholar]
- 96.Li H, Handsaker B, Wysoker A, Fennell T, Ruan J, Homer N, Marth G, Abecasis G, and Durbin R (2009). The Sequence Alignment/Map format and SAMtools. Bioinformatics 25, 2078–2079. 10.1093/bioinformatics/btp352. [DOI] [PMC free article] [PubMed] [Google Scholar]
- 97.Martin M (2011). Cutadapt removes adapter sequences from high-throughput sequencing reads. EMBnet. journal 17, 10–12. [Google Scholar]
- 98.Dobin A, Davis CA, Schlesinger F, Drenkow J, Zaleski C, Jha S, Batut P, Chaisson M, and Gingeras TR (2013). STAR: ultrafast universal RNA-seq aligner. Bioinformatics 29, 15–21. 10.1093/bioinformatics/bts635. [DOI] [PMC free article] [PubMed] [Google Scholar]
- 99.Landthaler M, Gaidatzis D, Rothballer A, Chen PY, Soll SJ, Dinic L, Ojo T, Hafner M, Zavolan M, and Tuschl T (2008). Molecular characterization of human Argonaute-containing ribonucleoprotein complexes and their bound target mRNAs. Rna 14, 2580–2596. 10.1261/rna.1351608. [DOI] [PMC free article] [PubMed] [Google Scholar]
- 100.Lajoie MJ, Rovner AJ, Goodman DB, Aerni HR, Haimovich AD, Kuznetsov G, Mercer JA, Wang HH, Carr PA, Mosberg JA, et al. (2013). Genomically recoded organisms expand biological functions. Science 342, 357–360. 10.1126/science.1241459. [DOI] [PMC free article] [PubMed] [Google Scholar]
- 101.Pirman NL, Barber KW, Aerni HR, Ma NJ, Haimovich AD, Rogulina S, Isaacs FJ, and Rinehart J (2015). A flexible codon in genomically recoded Escherichia coli permits programmable protein phosphorylation. Nat Commun 6, 8130. 10.1038/ncomms9130. [DOI] [PMC free article] [PubMed] [Google Scholar]
- 102.Gassaway BM, Cardone RL, Padyana AK, Petersen MC, Judd ET, Hayes S, Tong S, Barber KW, Apostolidi M, Abulizi A, et al. (2019). Distinct Hepatic PKA and CDK Signaling Pathways Control Activity-Independent Pyruvate Kinase Phosphorylation and Hepatic Glucose Production. Cell Rep 29, 3394–3404 e3399. 10.1016/j.celrep.2019.11.009. [DOI] [PMC free article] [PubMed] [Google Scholar]
- 103.Dobin A, Davis CA, Schlesinger F, Drenkow J, Zaleski C, Jha S, Batut P, Chaisson M, and Gingeras TR (2013). STAR: ultrafast universal RNA-seq aligner. Bioinformatics 29, 15–21. 10.1093/bioinformatics/bts635. [DOI] [PMC free article] [PubMed] [Google Scholar]
- 104.Trapnell C, Hendrickson DG, Sauvageau M, Goff L, Rinn JL, and Pachter L (2013). Differential analysis of gene regulation at transcript resolution with RNA-seq. Nat Biotechnol 31, 46–53. 10.1038/nbt.2450. [DOI] [PMC free article] [PubMed] [Google Scholar]
- 105.Ge SX, Jung D, and Yao R (2020). ShinyGO: a graphical gene-set enrichment tool for animals and plants. Bioinformatics 36, 2628–2629. 10.1093/bioinformatics/btz931. [DOI] [PMC free article] [PubMed] [Google Scholar]
Associated Data
This section collects any data citations, data availability statements, or supplementary materials included in this article.
Supplementary Materials
Lists of PAR-CLIP binding sites from 25 individual experiments for PKM1/2 and HNRNPF.
G4 sequence enrichment in publicly available PAR-CLIP data and from this paper.
Data Availability Statement
Data produced within this study are publicly available as of the date of publication from the Gene Expression Omnibus (GEO) under the accession number GSE179817. This paper analyzes existing, publicly available data. The accession numbers for the datasets are listed in the key resources table.
Key Resources Table.
| REAGENT or RESOURCE | SOURCE | IDENTIFIER |
|---|---|---|
| Antibodies | ||
| Anti-FLAG M2 Magnetic Beads | Sigma-Aldrich | M8823 |
| Anti-FLAG M2 antibody | Sigma-Aldrich | F3165 |
| Alexa Fluor 488 Secondary Antibody | Thermo Fisher Scientific | A-11034 |
| Alexa Fluor 594 Secondary Antibody | Thermo Fisher Scientific | A-11032 |
| Anti-HNRNPF Antibody | hpa069667 | |
| Anti-PKM2 (D78A4) | Cell Signaling | 4053 |
| Anti-PKM | Abcam | ab150377 |
| Anti-RNA polymerase II CTD repeat YSPTSPS antibody - ChIP Grade | Abcam | ab26721 |
| Anti-RNA polymerase II CTD repeat YSPTSPS (phospho S2) antibody | Abcam | (ab5095) |
| Anti-RNA polymerase II CTD repeat YSPTSPS (phospho S5) antibody | Abcam | (ab5131) |
| GAPDH | ProteinTech | 10494-1-AP |
| Bacterial and virus strains | ||
| E. coli BL21 | NEB | C2527H |
| E. coli C321.ΔA | Addgene | 48998 |
| E. coli 5-alpha | NEB | C2987H |
| Chemicals, peptides, and recombinant proteins | ||
| 4-Thiouridine | BIOSYNTH | NT06186 |
| ATP Solution (100 mM) | Thermo | R0441 |
| Blasticidin S | Gibco | A1113903 |
| Blasticidin S HCl | Gibco | A1113903 |
| Chloroform:Isoamyl alcohol 24:1 | Sigma | C0549-1PT |
| cOmplete Protease Inhibitor Cocktail | Roche | 1.1697E+10 |
| Deoxynucleotide (dNTP) Solution Mix | NEB | 10966034 |
| DMEM, high glucose | Gibco | 11965092 |
| Dynabeads Protein G for Immunoprecipitation | Invitrogen | 10004D |
| EMEM | ATCC | 30-2003 |
| Fetal Bovine Serum | GeminiBio | 100-800 |
| FLAG Peptide | Sigma | F3290 |
| Gateway BP Clonase II Enzyme mix | Invitrogen | 11789020 |
| Gateway LR Clonase II Enzyme mix | Invitrogen | 11791020 |
| GlycoBlue Coprecipitant | Thermo Fisher Scientific | AM9515 |
| HisPur™ Ni-NTA Magnetic Beads | Thermo Scientific | 88831 |
| Hygromycin B | Gibco | 10687010 |
| Insulin solution from bovine pancreas | Sigma | I0516 |
| IPTG | MP Biomedicals | 02102101-CF |
| Lipofectamine 3000 | Invitrogen | L3000001 |
| Lipofectamine RNAiMAX | Invitrogen | 13778075 |
| Opti-MEM I Reduced Serum Medium | Gibco | 31985070 |
| PageRuler Plus, Prestained Protein Ladder | Thermo Fisher Scientific | 26620 |
| Penicillin-Streptomycin | Gibco | 15140163 |
| Platinum Taq DNA polymerase | Thermo Fisher Scientific | 10966034 |
| Proteinase K | Millipore Sigma | 3115879001 |
| Puromycin Dihydrochloride | Gibco | A1113803 |
| Quick CIP | NEB | M0525S |
| RNase I | Thermo Fischer Scientific | AM2294 |
| RNase T1 | Thermo Fischer Scientific | EN0542 |
| Rnl1 T4 RNA ligase | Thermo Fischer Scientific | EL0021 |
| SUPERase•In RNase inhibitor | Thermo Fisher Scientific | AM2694 |
| Superscript IV | Thermo Fisher Scientific | 18090010 |
| T4 PNK | NEB | M0201S |
| Critical commercial assays | ||
| EnzyChrom Pyruvate Kinase Assay Kit | Bio Assay Systems | EPRK-100 |
| EnzyLight ATP Assay kit | Bio Assay Systems | EATP-100 |
| Deposited data | ||
| RNA-Seq | This study | GSE179817 |
| PARCLIP | This study | GSE179817 |
| RBNS | This study | GSE179817 |
| CHIP-Seq | This study | GSE179817 |
| Normalized TCGA expression data | TCGA | GSE62944 |
| Hybrid E/M state breast cancer cells | Kröger et al.76 | GSE119149 |
| Experimental models: Cell lines | ||
| HEK293 T-Rex Flp-In | Thermo Fisher Scientific | R78007 |
| MCF-7 | ATCC | HTB-22 |
| MDA-MB-231 | ATCC | HTB-26 |
| 293T/17 [HEK 293T/17] | ATCC | CRL-11268 |
| Experimental models: Organisms/strains | ||
| NOD scid gamma (NSG) mice | The Jackson Laboratory | 005557 |
| Oligonucleotides | ||
| DsPKM 3’UTR | IDT | hs.Ri.PKM.13.3 |
| DsSCRAMBLE | IDT | 51-01-14-03 |
| Plasmids | ||
| pOG44 Flp-Recombinase Expression Vector | Invitrogen | V600520 |
| pLKO.1 | Addgene | 8453 |
| pFRT_TO_DESTFLAGHA | Addgene | 26361 |
| pMDLg/pRRE | Addgene | 12251 |
| pRSV-Rev | Addgene | 12253 |
| pMD2.G | Addgene | 12259 |
| pET-28a-hPKM1 | Addgene | 44241 |
| pET-28a-hPKM2 | Addgene | 44242 |
| pCRT7 NT Topo | Addgene | 73446 |
| SepOTSA | Addgene | 68292 |
| Software and algorithms | ||
| ImageJ | Fiji | SCR_002285 |
| GraphPad Prism | GraphPad | https://www.graphpad.com/ |
| ChimeraX | Petterson et al.95 | http://plato.cgl.ucsf.edu/chimerax/download.html |
| Samtools Version: 1.9 | Li et al.96 | https://samtools.sourceforge.net/ |
| PyMOL | Schrödinger | https://www.pymol.org |
| Cutadapt v2.4 | Martin97 | https://github.com/marcelm/cutadapt |
| STAR v2.7.2b | Dobin et al.98 | https://github.com/alexdobin/STAR |
| Other | ||
| Slide-A-Lyzer™ Dialysis Cassette, 10K MWCO | Thermo Fisher Scientific | 66380 |
| Pierce™ Protein Concentrators PES | Thermo Fisher Scientific | 88513 |
| Ni-charged MagBeads | GenScript | L00295 |
This paper does not report any original code.
Any additional information required to reanalyze the data reported in this paper is available from the lead contact upon request.