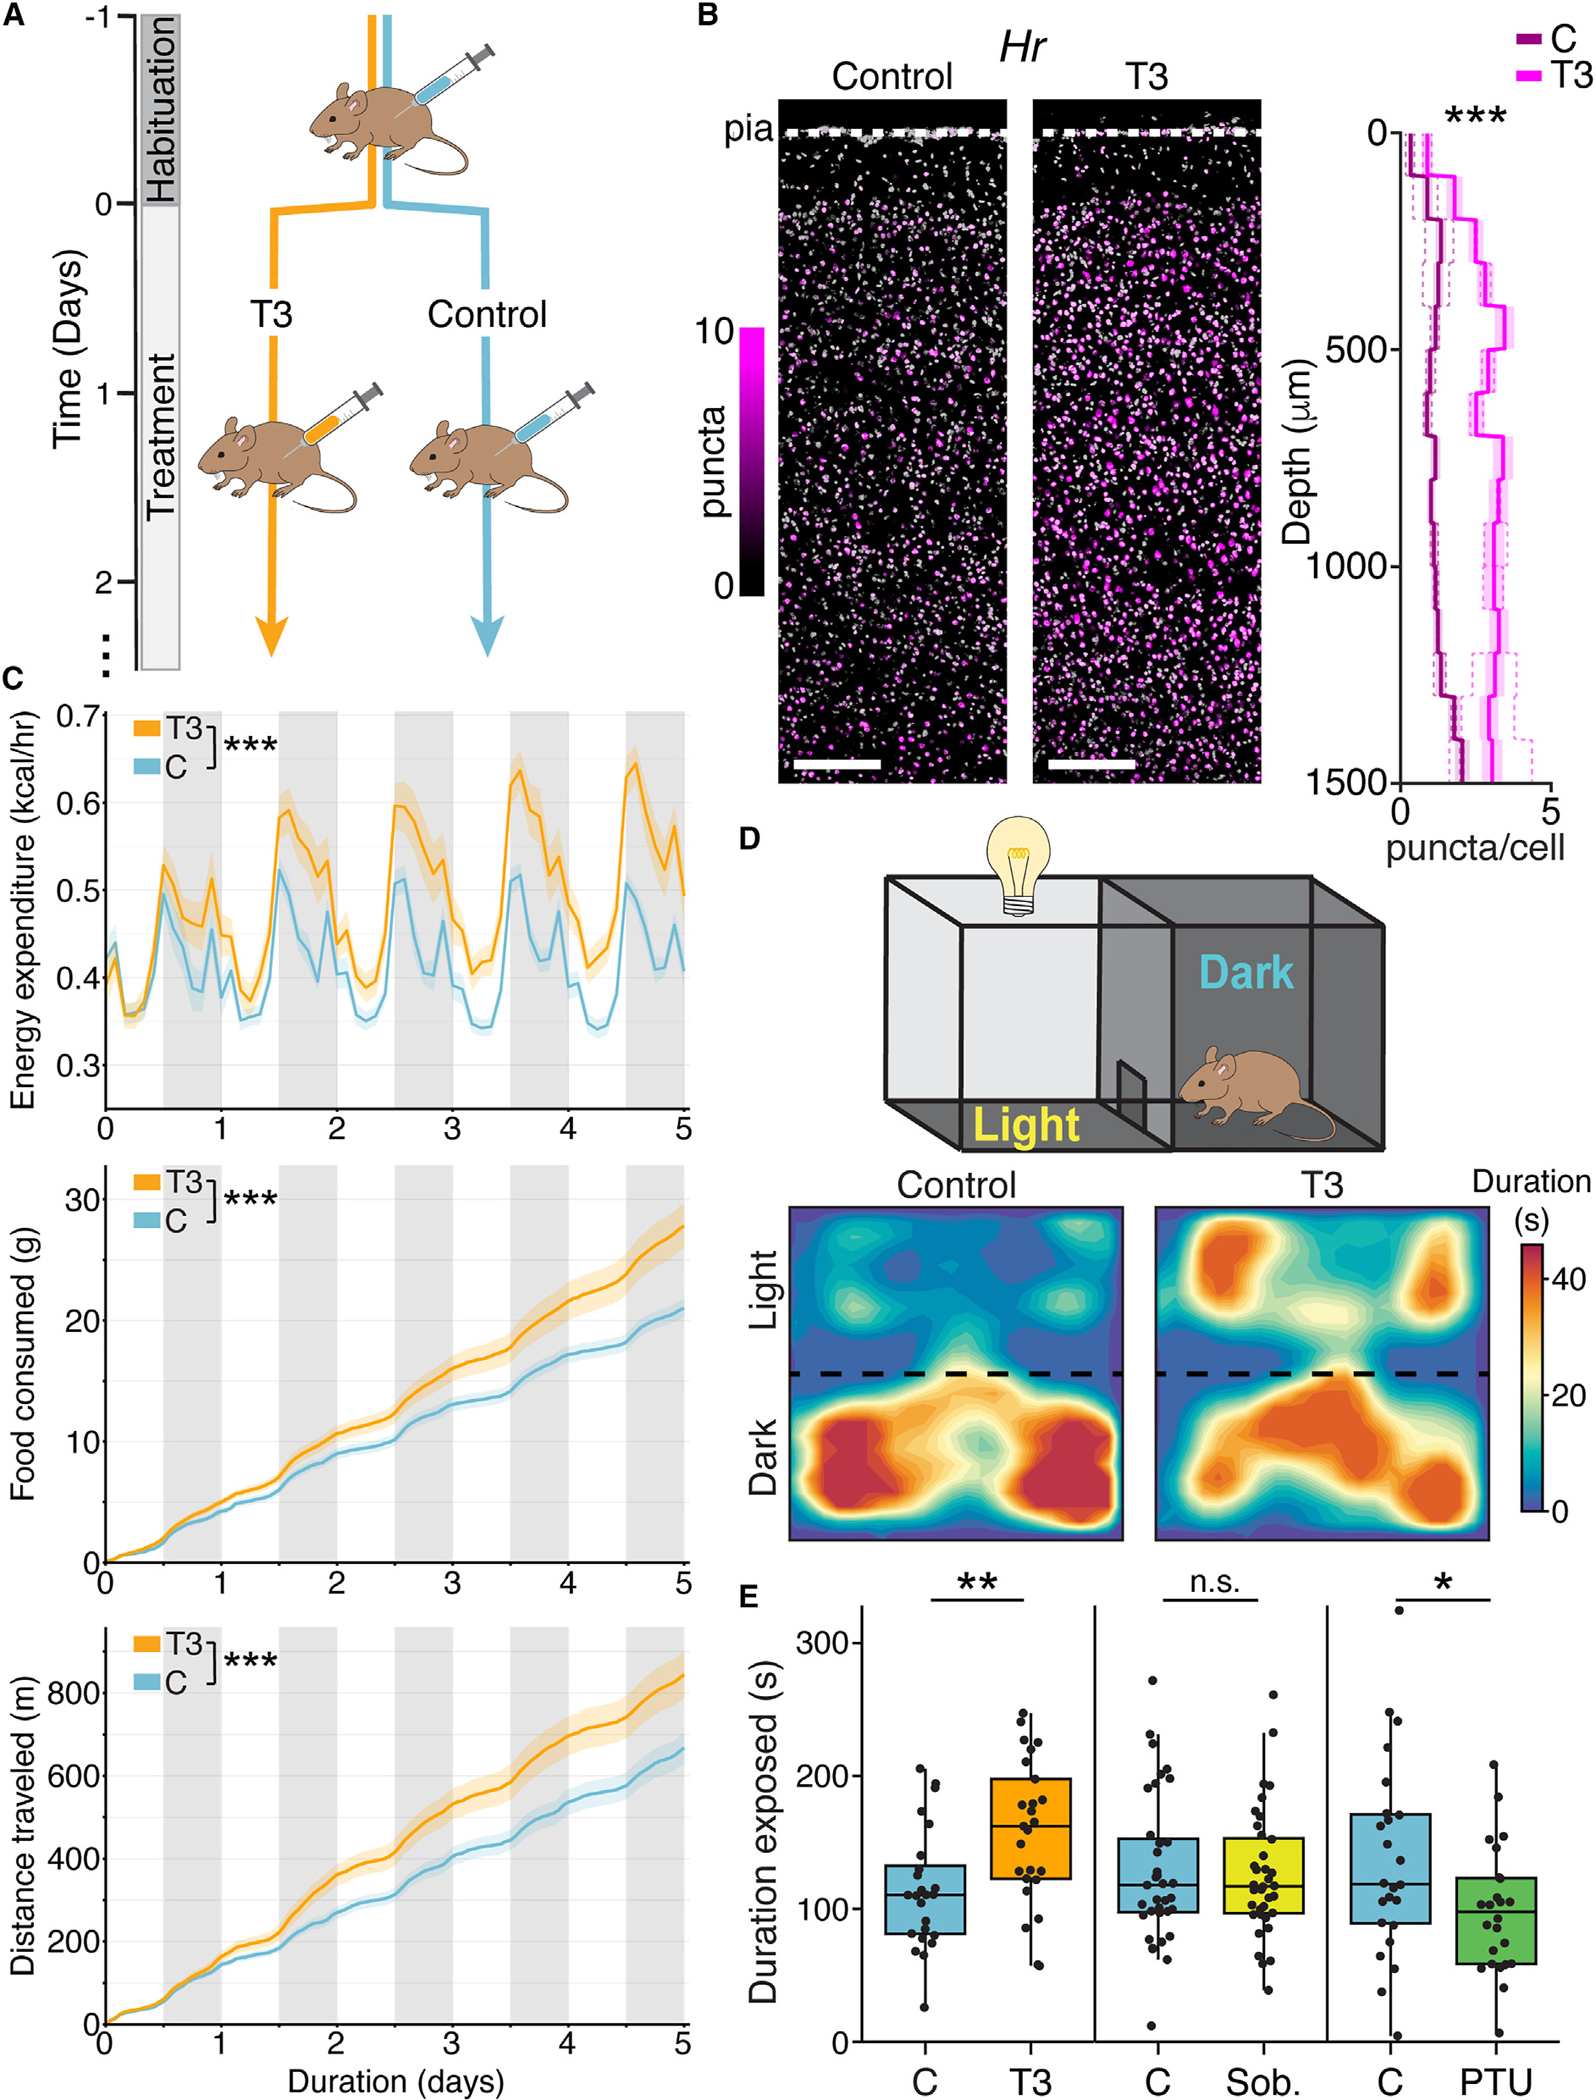
Figure 1. Brain-penetrant T3 induces transcription in cortex and modulates spontaneous exploratory behaviors.

(A) Mice were habituated to IP injections with vehicle and were then divided into T3 and vehicle control cohorts.
(B) FISH of Hr in M2 (left: control; middle: T3; nuclei pseudo-colored by number of puncta, see Figure S1E). Scale bars, 200 μm. Right: Hr expression as a function of cortical depth. Hr is upregulated by T3 across cortex (p = 0, Wilcoxon rank-sum test comparing treatment effect across entire cortical depth; control: n = 5,494 cells; T3: n = 6,061; 2 mice per condition). Central line/shade: mean/95% confidence intervals. Dotted lines: mean expression values per mouse.
(C) Home-cage indirect calorimetry revealed that energy expenditure, food consumption, and distance traveled significantly increased with T3 treatment (p < 10−4, likelihood ratio tests, n = 16 control, n = 15 T3-treated mice). Central line/shade: mean/SEM.
(D) Top: schematic of light-dark preference assay (LD). Bottom: example heatmaps of the duration that a control (left) and a T3-treated (right) mouse occupied each area of the LD box.
(E) Duration male mice stayed in the light-exposed zone increased with T3 (left) (p = 0.004, n = 24 control, n = 25 T3 mice), was unaffected by sobetirome (middle) (p = 0.818, n = 35 control, n = 36 sobetirome mice), and decreased with PTU (right) (p = 0.04, n = 24 control, n = 24 mice). Welch’s t tests. Central line: median, box: IQ, whiskers: data within 1.5× IQR. Black dots indicate data from single mice.
For all panels: n.s., not significant; *p < 0.05, **p < 0.01, ***p < 0.001.
See also Figures S1, S2, and S3.
