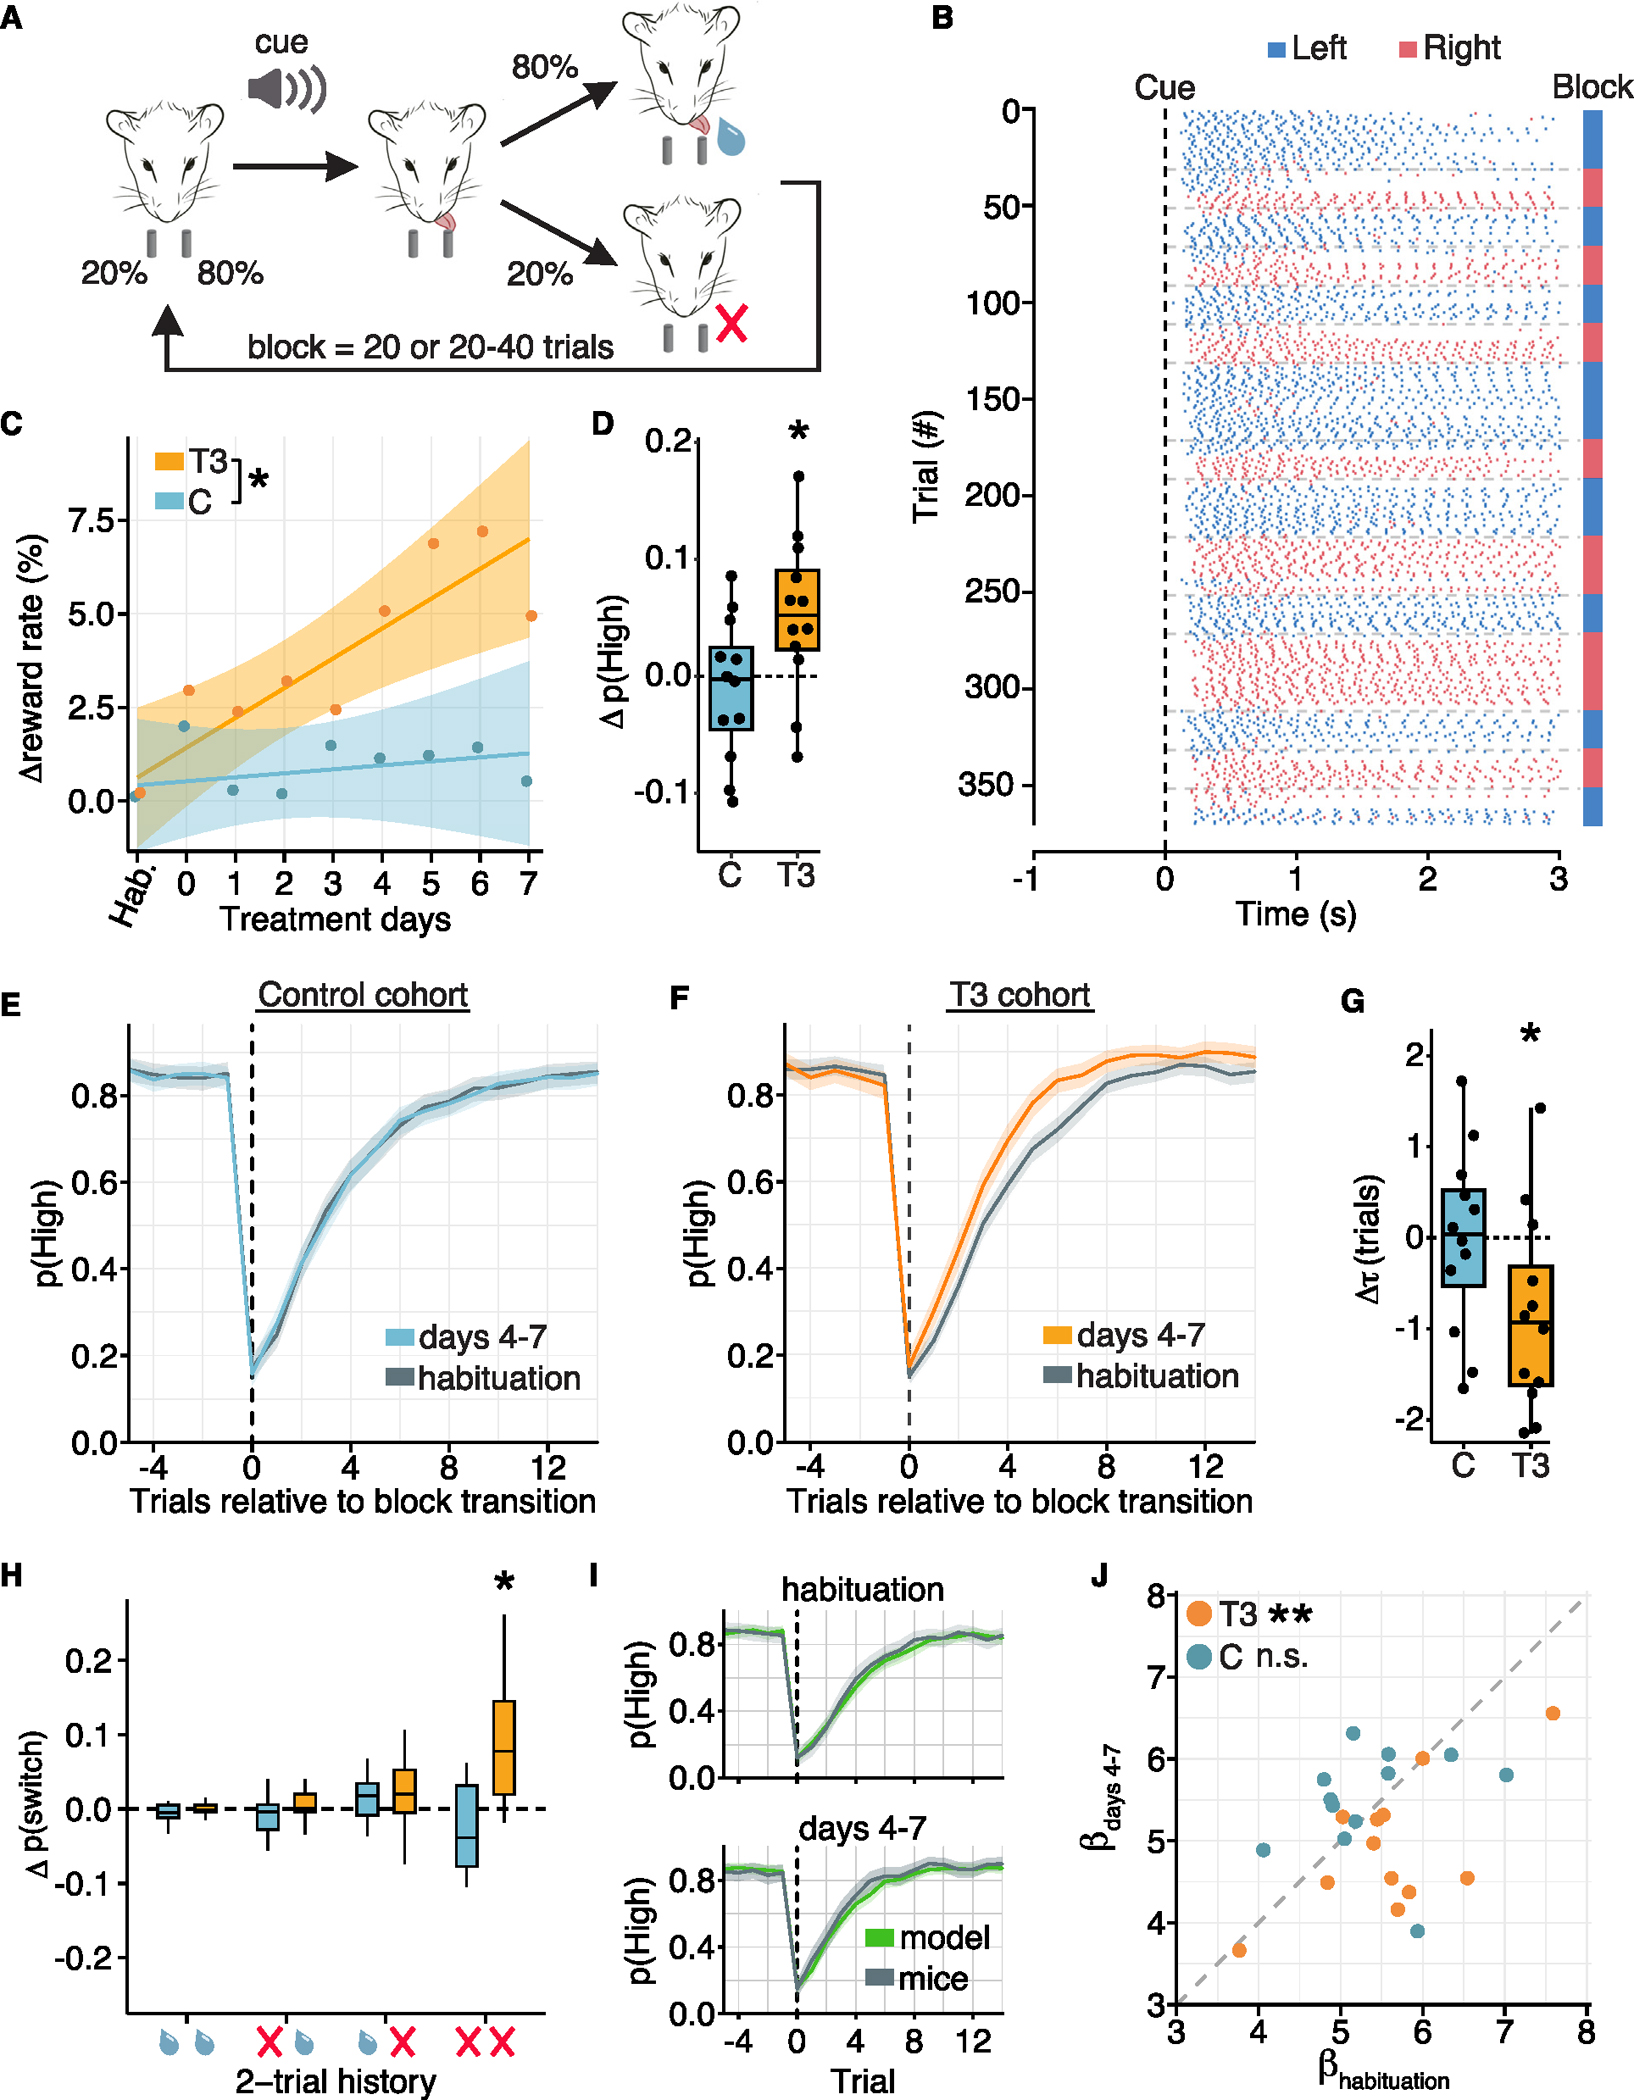
Figure 5. T3 alters decision-making and exploration in the 2-armed bandit task.

(A) Schematic of the 2ABT. On each trial, one spout is likely to dispense a water droplet (80%), and the other spout is unlikely (20%). A tone (5 kHz) cues the start of the selection period, during which a mouse can make a choice by licking one of the two spouts. The mouse then receives water drops according to its spout choice and reward probabilities. Reward probabilities are dynamic, switching without cue after a block of 20 trials for data presented in (C)–(J), or blocks of 20–40 trials for that in Figures 6C–6I.
(B) Raster plot from a 2ABT session (blocks of 20–40 trials) showing individual licks to left (blue) and right (red) spouts as a function of time from start of tone, marking the selection period (black dotted line). Color code (right) indicates the identity of the highly rewarding spout. Gray dotted lines mark block transitions.
(C) Percent change in reward rate (rewards/trial) relative to habituation days (Hab.) for T3 (orange) and vehicle (blue) treated mice. The reward rate of each mouse was normalized to the median rate during habituation. Dots indicate the average change in reward rate across mice per day. Lines/shade: linear fits/95% confidence intervals. There was a significant interaction of treatment condition and change in reward rate over the experiment (p = 0.03, likelihood ratio test), and the rate increased with T3 treatment (linear regression, F = 12.42 (1,134), p < 10−3), but was stable with control treatment (linear regression, F < 10−3 (1,139), p = 0.62). Normalized reward rate of T3-treated animals significantly increased on and after 4 days of treatment (day 0: p = 0.21, 1: p = 0.34, 2: p = 0.17, 3: p = 0.32, 4: p = 0.02, 5: p = 0.007, 6: p = 0.001, 7: p = 0.04; likelihood ratio test).
(D) Change in probability of selecting the highly rewarding spout, p(High), between the habituation period and treatment days 4–7 calculated as the differences of median values. Black dots: single mice. T3-treated mice significantly increased p(High) (p = 0.02), whereas vehicle-treated mice did not (p = 0.55). Paired t tests.
(E) p(High) as a function of trial position within a block for vehicle-treated mice during habituation (gray) or treatment days 4–7 (blue). Trial 0 marks the first trial of a new block. Shading: 95% confidence intervals.
(F) As in (E) but for T3-treated mice (treatment days 4–7, orange).
(G) Change in the time constant (τ) from exponential fits to p(High) after the block transition between habituation and treatment days 4–7. Black dots: single mice. T3-treated mice had a significant decline in τ (p = 0.02); vehicle-treated mice did not (p = 0.93). Paired t tests.
(H) Change in conditional switch probabilities, dependent on reward outcomes of the previous 2 trials, between habituation and treatment days 4–7. The 4 most common histories are plotted, which resulted from selecting the same spout on two consecutive trials with varying reward outcomes, represented by a water droplet (reward) or red X (no reward). T3-treated mice increased their probability of switching spouts in response to two consecutive failures (p-adjusted = 0.02). No other conditional switch probabilities changed (p-adjusted > 0.05). Paired t tests with Benjamini-Hochberg correction.
(I) Q-learning model predictions on held-out data of p(High) around block transitions from habituation (top) and days 4–7 (bottom). Gray line is mean probability from the mouse data (T3 cohort); green line is the model prediction. Shading: 95% confidence intervals. The model fit the data well for all treatments and epochs (for T3 cohort, spout-choice prediction accuracy on held-out data during habituation: 0.85 ± 0.03, mean ± SD; days 4–7: 0.85 ± 0.03; comparison between epochs: p = 0.52; for control cohort, spout-choice prediction accuracy on held-out data during habituation: 0.85 ± 0.03; days 4–7: 0.86 ± 0.03; comparison between epochs: p = 0.64; paired t tests).
(J) Scatterplot of β parameter fits during habituation (x axis) and days 4–7 of treatment (y axis) for each animal. T3-treated mice had a significant decrease in β between habituation and days 4–7 (p = 0.008), whereas vehicle-treated mice did not (p = 0.69). Paired t test.
For all analyses, n = 12 animals for each treatment condition (T3 or control). *p < 0.05, **p < 0.01. For all boxplots, central line: median, box: IQ, whiskers: data within 1.5× IQR.
See also Figure S6.
