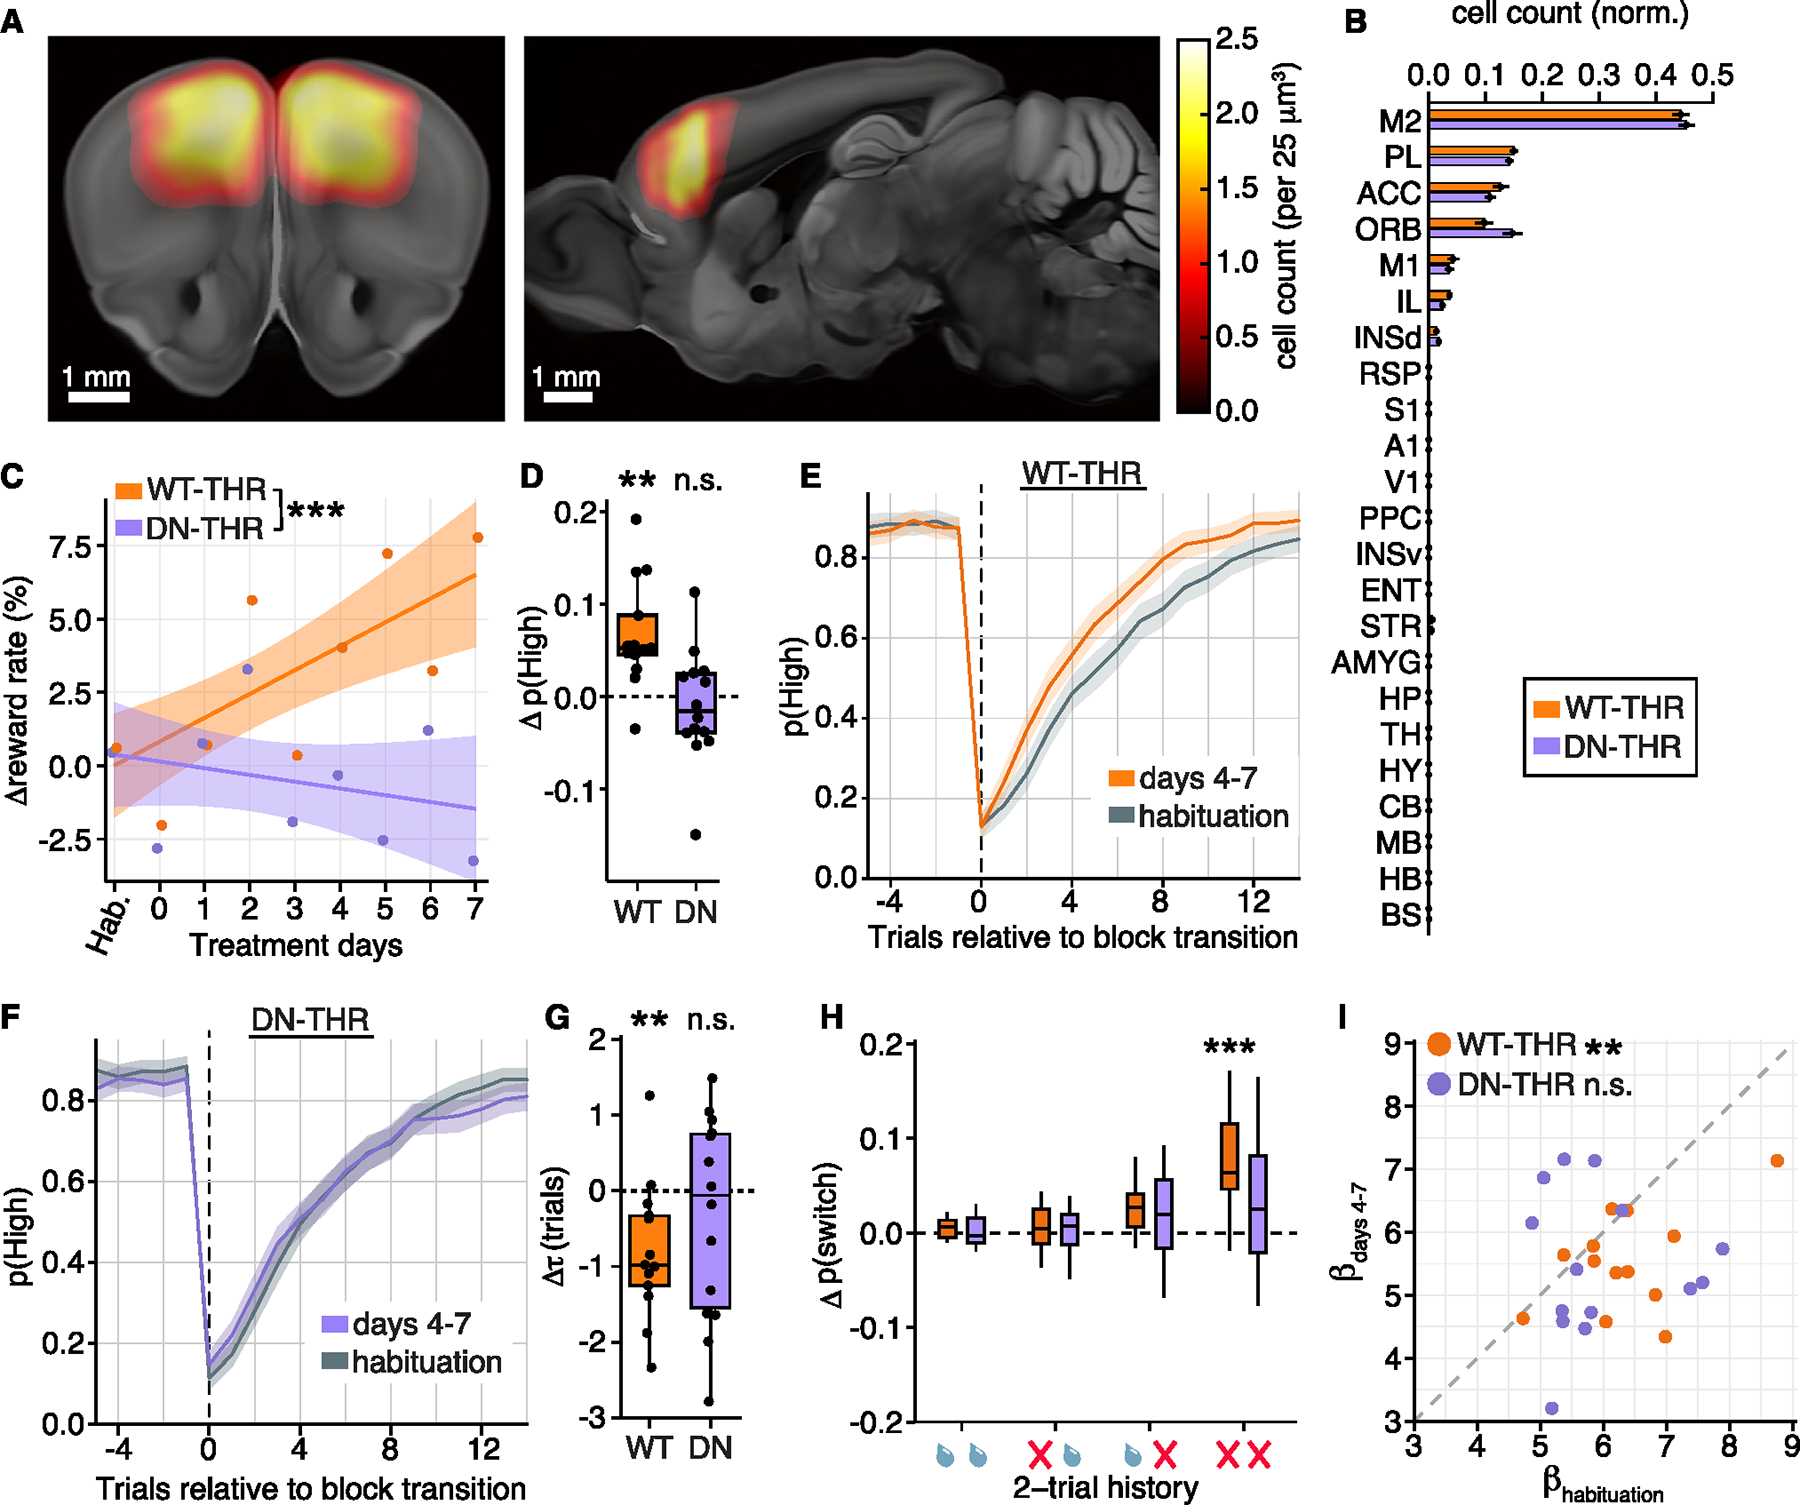
Figure 6. T3-dependent transcriptional cascades in frontal cortex neurons underlie T3 mediated changes in exploratory decision-making.

(A) Average heatmaps of DN-THR expression in the cohort of mice performing the 2ABT. Scale bars, 1 mm. Left: coronal section ~2 mm anterior to bregma. Right: sagittal section ~1 mm from midline. An extended selection of heatmaps of both DN-THR and WT-THR animals is in Figure S6M.
(B) Bar plot of the normalized count of WT-THR (orange) and DN-THR (purple) cells across brain regions. Brain region expression was similar between WT-THR and DN-THR cohorts (Table S4). Bar/error bar: mean/SEM.
(C) The percent change in reward rate (rewards/trial) over habituation and treatment. All habituation days are grouped (Hab.), and the reward rate of each mouse was normalized to the median rate during habituation. Dots indicate the average change in reward rate per day for WT-THR (orange) and DN-THR (purple) animals. Both cohorts received T3. Lines/shade: linear fits/95% confidence intervals. There was a significant interaction of genotype (WT-THR/DN-THR) and treatment duration (p < 10−3, likelihood ratio test). WT-THR animals increased their reward rate with T3 treatment (linear regression, F = 14.14 (1,154), p < 10−3), while DN-THR animals did not (linear regression, F = 1.11 (1,166), p = 0.29).
(D) Change in p(High) between the habituation period and treatment days 4–7 calculated as the difference of median values from each period. WT-THR mice significantly increased p(High) (p = 0.001), DN-THR mice did not (p = 0.54). Paired t tests.
(E) p(High) for WT-THR animals as a function of trial position within a block. Orange line: mean probabilities over days 4–7. Gray line: mean probabilities over habituation days. Shading: 95% confidence intervals.
(F) As in (E) but for DN-THR animals (treatment days 4–7, purple).
(G) Change in time constant (τ) of recovery of p(High) from exponential fits of the data (aligned to the block transition) between the habituation period and days 4–7. WT-THR mice had a significant decline in τ (p = 0.009), DN-THR mice did not (p = 0.35). Paired t tests.
(H) Change in conditional switch probabilities between the habituation period and days 4–7 (as in Figure 5H). WT-THR mice increased their probability of switching spouts in response to two consecutive failures (p-adjusted < 10−3); DN-THR did not (p-adjusted = 0.40). No other conditional switch probabilities changed (p-adjusted > 0.05). Paired t tests with Benjamini-Hochberg correction.
(I) Scatterplot of β parameter fits during habituation (x axis) and treatment days 4–7 (y axis) for each animal. WT-THR mice significantly decrease β between habituation and days 4–7 (p = 0.007); DN-THR mice did not (p = 0.28). Paired t tests.
For post hoc histology and quantification in (A) and (B), WT-THR cohort: n = 12 animals, DN-THR cohort: n = 10 animals. For all other analyses, WT-THR cohort: n = 13 animals, DN-THR cohort: n = 14 animals. **p < 0.01, ***p < 0.001. Black dots represent data from single mice. For all boxplots, central line: median, box: IQ, whiskers: data within 1.5× IQR.
See also Figure S6.
