FIG. 6.
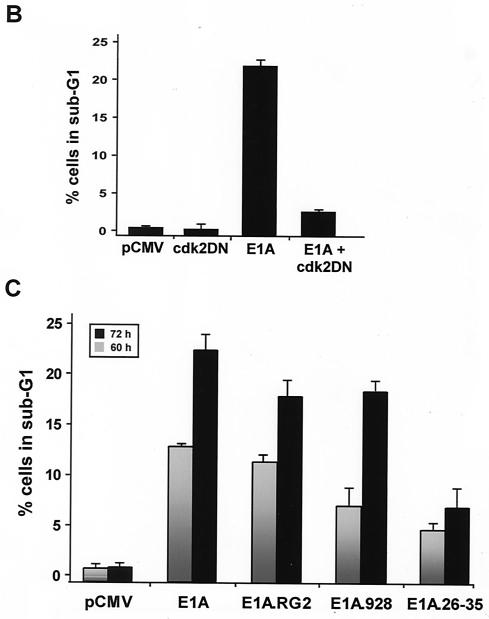
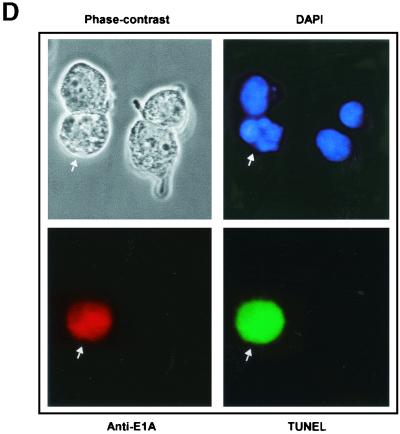
(facing page). Prolonged expression of E1A in doxorubicin-treated p21+/+ cells leads to apoptosis. (A) p21+/+ cells were cotransfected in parallel with the indicated plasmids (pCMV and pCMV-E1A12S, -E1A.RG2, -E1A.928, and -E1A.dl26-35) and a pCMV-CD20 expression vector. Immediately after, the cells were treated with doxorubicin, and at 60 and 72 h posttransfection, the DNA content was analyzed by propidium iodide staining and fluorescence-activated cell sorting analysis of CD20-positive cells. Only normal-size cells with slight loss of DNA content were analyzed, while doublets and debris, resulting from aggregates or necrotic death, were avoided. One representative experiment showing the percentage of cells with a sub-G1 DNA content (M1) at the 72-h time point is indicated. (B) p21+/+ cells were cotransfected with 12 μg of control plasmid (pCMV) or pCMV-Cdk2DN, pCMV and pCMV-E1A12S (8:4), or pCMV-E1A12S and pCMV-Cdk2DN (8:4) along with 2 μg of the pCMV-CD20 expression vector. Immediately after, the cells were treated with doxorubicin for 72 h. Apoptosis was measured as described for panel A, and the percentage of cells with a sub-G1 DNA content is summarized in a histogram. (C) Percentage of cells with a sub-G1 DNA content based on the data shown in panel A and derived from three separate experiments. (D) p21+/+ cells were transfected with pCMV-E1A12S and cultured in the presence of doxorubicin for 72 h. Afterwards, the cells were fixed and triple stained with DAPI and anti-E1A and for TUNEL. A fluorescence microscope analyzed a total of 100 cells, and the number of E1A-expressing cells undergoing apoptosis was about 25 to 30%. Phase contrast of the same field is also shown, and the arrows indicate an E1A-transfected cell in the advanced stages of apoptosis.


