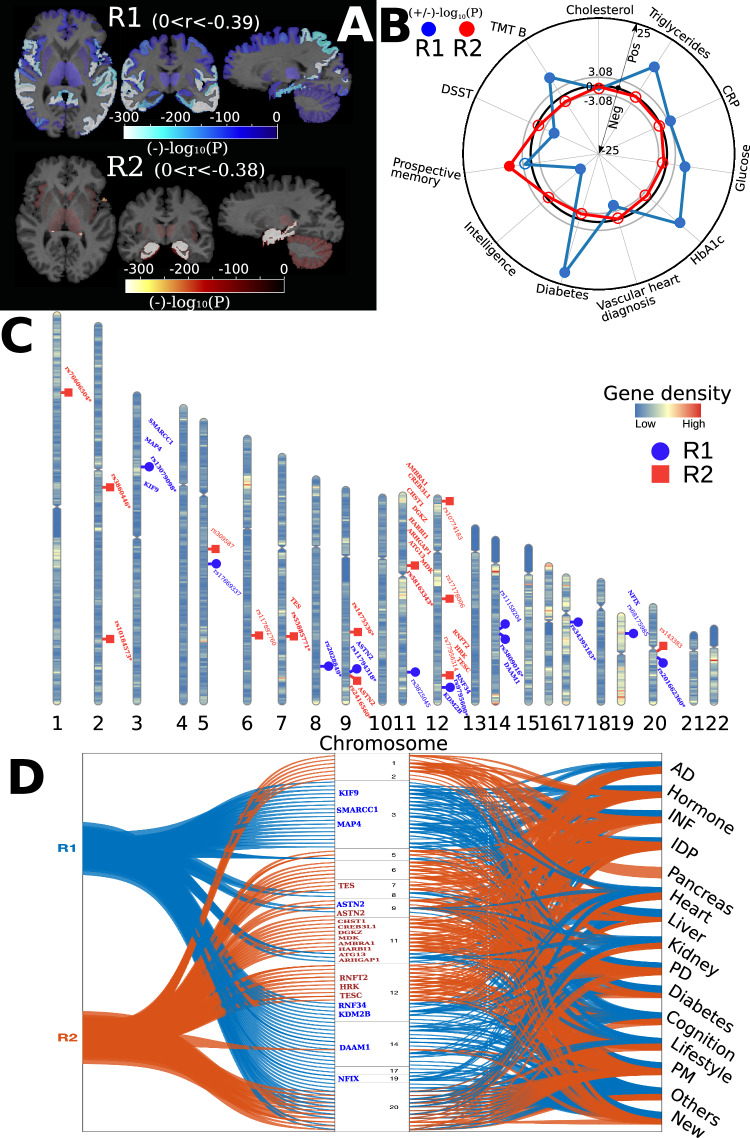
Fig. 2. The expression of the R1 and R2 dimensions in the general population.
A Brain association studies confirm the presence of the two dimensions in the general population: the R1 dimension shows widespread brain atrophy, whereas the R2 dimension displays focal medial temporal lobe atrophy. p value and effect sizes (r, Pearson’s correlation coefficient) are presented in Supplementary eTable 4. The brain maps denote the signed p value, and the range of r for each dimension is also shown. Of note, the sample size (N) for R1 and R2 is the same for each ROI. B Clinical association studies further show that the R2 dimension is associated with prospective memory, and the R1 dimension is associated with several cognitive dysfunctions, cardiovascular risk factors (e.g., triglycerides), and diabetes (e.g., HbA1c). The same linear regression models were used to associate the R1 and R2 dimensions with the 61 clinical variables, including cardiovascular factors, diabetic blood markers, social demographics, lifestyle, physical measures, cognitive scores, and imaging-derived phenotypes. The radar plot shows representative clinical variables; all other results are presented in Supplementary eTable 5. The gray circle lines indicate the p value threshold in both directions (Bonferroni correction for the 61 variables: −log10(p value) >3.08). A positive/negative −log10(p value) value indicates a positive/negative correlation (beta). Transparent dots represent the associations that do not pass the Bonferroni correction; the blue-colored dots and red-colored dots indicate significant associations for the R1 and R2 dimensions, respectively. C Genome-wide association studies demonstrate that the R2 dimension is associated to a larger extent with genomic loci and genes previously associated with AD-related traits in the literature (genome-wide p value threshold with the red line: −log10(p value) >7.30). Each genomic locus is represented by its top lead SNP. The R1 dimension identified 8 (blue-colored in bold) out of the 49 mapped genes associated with AD-related traits. The R2 dimension identified 13 (red-colored in bold) out of 40 mapped genes associated with AD-related traits. Gene annotations were performed via positional, expression quantitative trait loci, and chromatin interaction mappings using FUMA (Supplementary eTable 6 for all mapped genes) [58]. The genomic loci and mapped genes were manually queried in the GWAS Catalog [55] to determine whether they were previously associated with AD (newly identified or not). * denotes that the genomic locus is newly identified. D Besides AD-related traits, the genes and genomic loci in the two dimensions were also associated with other clinical traits, including inflammation, neurohormones, and imaging-derived phenotypes, as shown in the literature from the GWAS Catalog [55]. The flowchart first maps the genomic loci and genes (left) identified in the two dimensions onto the human genome (middle). It then links these variants to any clinical traits identified in previous literature from the GWAS Catalog (right). In the middle of the human genome, we show chromosomes 1 to 22 (above to below); the blue and red-colored genes are AD-related for the R1 and R2 dimensions, respectively. The black-colored genes (C) are not annotated. INF inflammation, PD psychiatric disorder, PM physical measure; “New” (corresponding to the newly identified loci/genes in C) indicates that the locus or gene was not associated with any traits in the literature. DSST Digit Symbol Substitution Test, TMT Trail Making Test, CRP C-reactive protein, AD Alzheimer’s disease, PD Parkinson’s disease, INF inflammation, IDP imaging-derived phenotype.

