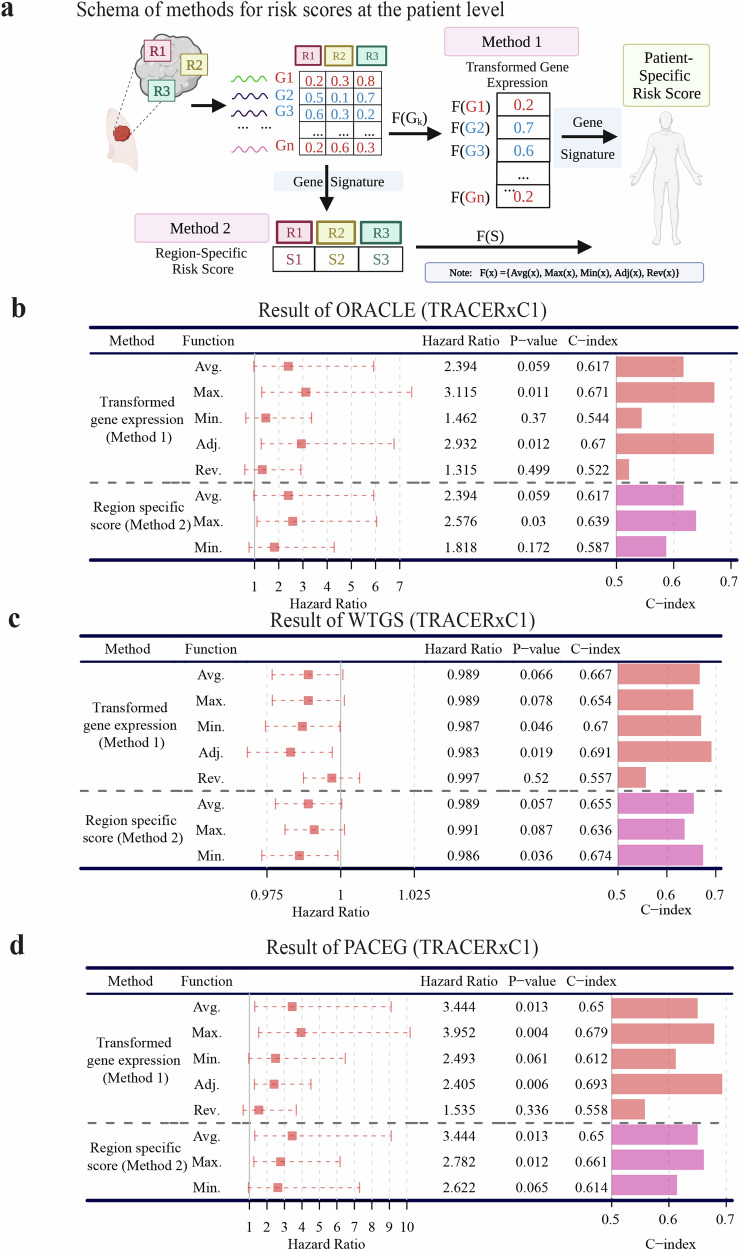
Fig. 3. Calculation of patient-specific risk scores using multiregional RNA-seq data.
a Two methods for calculating patient risk scores based on gene signatures. Method 1: Transform the expression of signature genes into patient-specific values and then compute the risk score of patients based on the signature. The transformation function calculated the average(Avg.)/maximal (Max.) (Adj.)/minimal (Min.) gene expression across all regions of each individual or summarized the maximal expression of hazardous genes and the minimal expression of protective genes (Adjusted, Adj.) or the reverse calculation (Rev.). Method 2: Apply the gene signature to all regions of a patient to obtain region-specific risk scores and then transform them into individual-level risk scores. The transformation function calculated the average(Avg.)/maximal (Max.) (Adj.)/minimal (Min.) region-specific scores of each individual. b–d Performance of three different prognostic signatures: b ORACLE, c WTGS, and d PACEG applied with eight functions from two methods of quantifying patient-specific risk score in the TRACERxC1 cohort. In the Hazard Ratio column, a 95% confidence interval was shown as a dotted line. The survival analysis measures disease-free survival.

