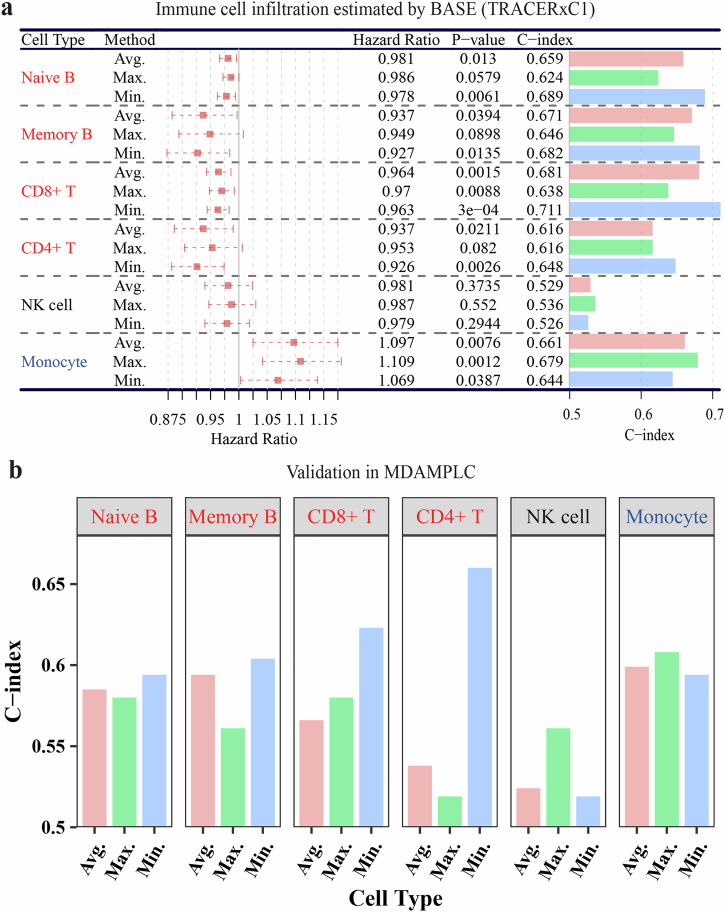
Fig. 4. Association of immune cell infiltration with patient survival.
a Forest plot showing the survival analysis results of six immune cells in TRACERxC1 cohort. The average (Avg.), maximal (Max.), and minimal (Min.) infiltration values of each immune cell were used to obtain the patient-level immune infiltration and then were analyzed with univariate Cox regression. In the Hazard Ratio column, a 95% confidence interval was shown as a dotted line. b The bar graph of the C-index evaluating the same immune cells in the MDAMPLC cohort. The infiltration level of six immune cell types was calculated in all regions of each patient. The minimal infiltration level of Naïve B, Memory B, CD8+ T, and CD4+ T cells (protective) but the maximal infiltration level of Monocyte (hazardous) achieves the highest prognostic association. The survival analysis measures disease-free survival.

