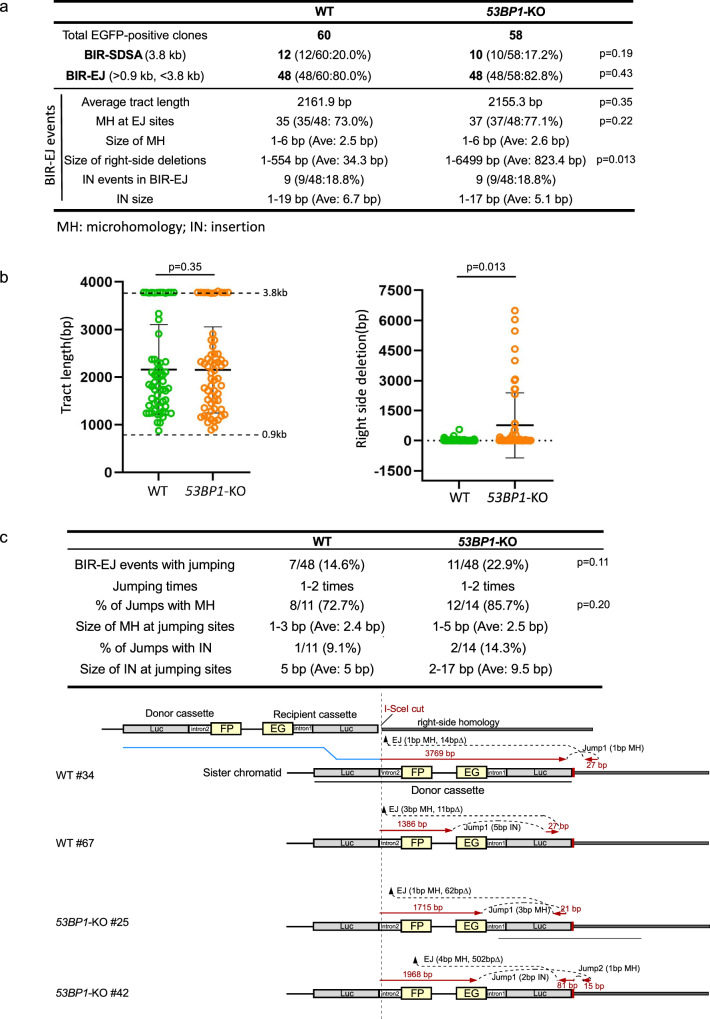
Fig. 2. Analysis of BIR events in WT and 53BP1-KO U2OS (EGFP-BIR/LTGC) cells.
a A summary of the data from two sets of experiments displaying the features of BIR repair products from single EGFP-positive clones derived from WT and 53BP1-KO (EGFP-BIR/LTGC) reporter cell lines after I-SceI cleavage. Genomic DNA extracted from single EGFP-positive clones was characterized by Sanger sequencing following PCR to determine the repair products and the repair junctions. The result of each set of experiments are shown in Supplementary Fig. 2a. b The BIR tract length (left) and the size of the right-side deletions in BIR-EJ events (right) were analyzed in EGFP-positive single clones derived from U2OS (EGFP-BIR/LTGC) WT and 53BP1-KO reporter cell lines after I-SceI cleavage. Group means are shown, and error bars represent ± SD. Dashed lines (3.8 kb and 0.9 kb) in the left panel indicate the upper and lower limits of the BIR tract length, respectively, that can be scored by the EGFP-BIR/LTGC reporter (see Fig. 1b). (WT n = 60 clones, 53BP1-KO n = 58 clones). c A summary of the data from two sets of experiments on the BIR-EJ events with jumping/template switching, assayed in U2OS (EGFP-BIR/LTGC) WT and 53BP1-KO reporter cell lines after I-SceI cleavage is shown at the top. The result of each set of experiments are shown in Supplementary Fig. 2b. Illustrations depicting examples of BIR-EJ events with jumping/template switching are presented at the bottom. In each example, the solid red lines represent the DNA synthesis tract copying the donor sequence, with the DNA synthesis length indicated. The red arrows represent the direction of DNA synthesis. The size of microhomology (MH) and insertion (IN) at each template jumping site, and at each end joining (EJ) site of the newly synthesized DNA ligated with the right end of the original DSB, is marked. Source data are provided as a Source data file.

