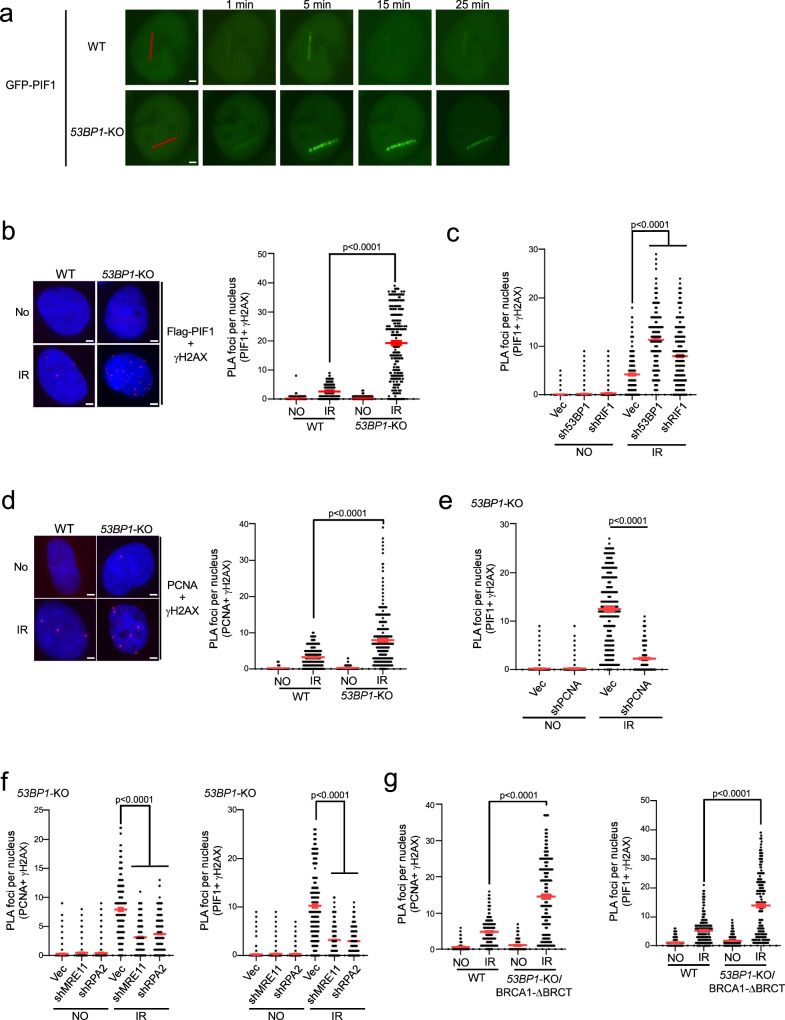
Fig. 4. PIF1 is accumulated at DSBs after IR when the 53BP1 pathway is compromised.
a Time-lapse live cell imaging of GFP-PIF1 in U2OS WT and 53BP1-KO cells was performed before and after laser-induced microirradiation. Red lines: laser-induced damage region. Scale bar =2 μm. Also see Supplementary Fig. 5a. b, c Recruitment of Flag-PIF1 to γH2AX sites was analyzed by PLA in U2OS WT and 53BP1-KO cells (b), or in U2OS cells expressing shRNAs targeting 53BP1 or RIF1 and a vector control (c) before and after IR (4 Gy) treatment. Left: representative PLA images. Right: quantification of PLA foci per nucleus. Also see Supplementary Fig. 5c for b and Supplementary Fig. 5d for c. Scale bar = 2 μm. (n = 300 cells). d Recruitment of PCNA to γH2AX sites was analyzed by PLA in U2OS WT and 53BP1-KO cells treated with or without IR (4 Gy). Left: representative PLA images. Right: quantification of PLA foci per nucleus. Also see Supplementary Fig. 5e. Scale bar = 2 μm. (n = 298 cells). e Recruitment of PIF1 to γH2AX sites was analyzed by PLA in U2OS cells expressing PCNA shRNA with vector as a control after treatment with IR (4 Gy). Quantification of PLA foci per nucleus is displayed. Also see Supplementary Fig. 5g. (n = 304 cells). f Recruitment of PCNA (left) and PIF1 (right) to γH2AX sites was analyzed by PLA in U2OS 53BP1-KO cells expressing shRNAs targeting MRE11 or RPA2 with vector as a control after treatment with IR (4 Gy). Quantification of PLA foci per nucleus is displayed. Also see Supplementary Fig. 5h. (n = 300 cells). g Recruitment of PCNA (left) and PIF1 (right) to γH2AX sites was analyzed by PLA in U2OS WT and 53BP1-KO/BRCA1-ΔBRCT cells with or without treatment of IR (4 Gy). Three experiments were performed with ∼100 nuclei analyzed in each experiment. Quantification of PLA foci per nucleus is displayed. Also see Supplementary Fig. 5i. (n = 300 cells). b to g: Three experiments were performed with ∼100 nuclei analyzed in each experiment. Quantification of PLA foci per nucleus from a total of ~300 nuclei are displayed. Source data are provided as a Source data file.

