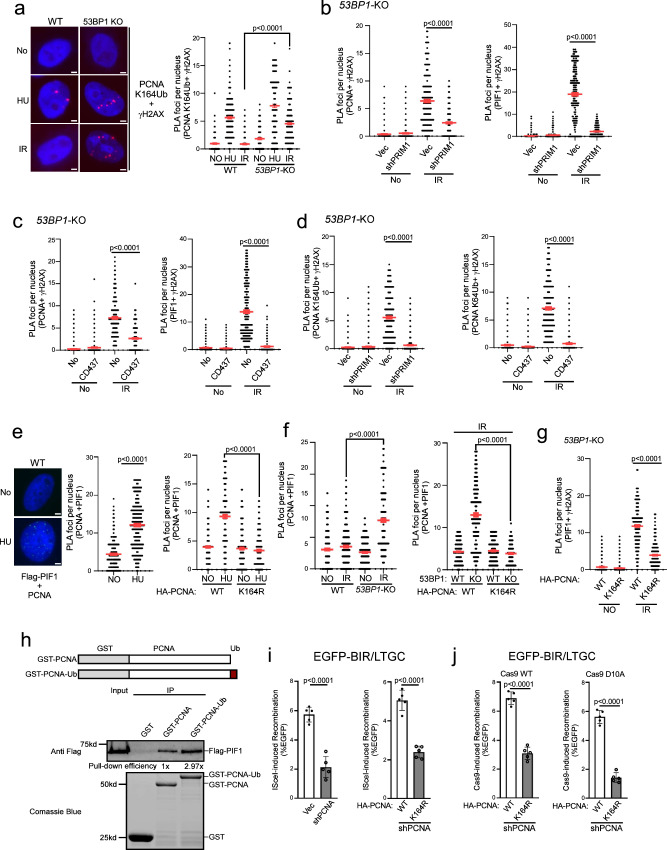
Fig. 5. Polα-primase activity is important for PCNA ubiquitination and PIF1 loading to deDSBs after IR to promote BIR.
a PCNA ubiquitination (K164) at γH2AX sites was analyzed by PLA in U2OS WT and 53BP1-KO cells before or after treatment with HU (1 mM, 24 h) or IR (4 Gy, 2 h after for PLA). Left: representative PLA images. Right: quantification of PLA foci per nucleus. Also see Supplementary Fig. 8a. Scale bar = 2 μm. (n = 300 cells). b Recruitment of PCNA (left) and PIF1 (right) to γH2AX sites was analyzed by PLA in U2OS 53BP1-KO cells expressing shRNA targeting PRIM1 upon IR (4 Gy, 2 h after for PLA). Quantification of PLA foci per nucleus is displayed. Also see Supplementary Fig. 8b. (n = 310 cells). c Recruitment of PCNA (left) and PIF1 (right) to γH2AX sites was analyzed by PLA in U2OS 53BP1-KO cells in the presence of Polα inhibitor CD437 (10 μM) upon IR (4 Gy, 2 h after for PLA). Quantification of PLA foci per nucleus is displayed. Also see Supplementary Fig. 8c. (n = 300 cells). d PCNA ubiquitination (K164) at γH2AX sites was analyzed by PLA in U2OS 53BP1-KO cells expressing shRNAs targeting PRIM1 (left) or in the presence of Polα inhibitor CD437 (10 μM, right) upon IR (4 Gy, 2 h after for PLA). Quantification of PLA foci per nucleus is displayed. Also see Supplementary Fig. 8d. (n = 306 cells). e PLA was performed to assay for the interactions of stably expressing Flag-PIF1 with endogenous PCNA in U2OS cells (left and middle) or with expressed HA-PCNA-WT and HA-PCNA-K164R (right) with or without HU treatment (1 mM, 24 h). Left: representative PLA images. Right: quantification of PLA foci per nucleus. Also see Supplementary Fig. 8e. Scale bar =2 μm. (n = 300 cells). f PLA was performed to assay for the interactions of stably expressing Flag-PIF1 with endogenous PCNA in U2OS WT and 53BP1-KO cells (left) or with expressed HA-PCNA-WT and HA-PCNA-K164R (right) with or without IR (4 Gy, 2 h after for PLA). Quantification of PLA foci per nucleus is displayed. Also see Supplementary Fig. 8f. (n = 300 cells). g Recruitment of PIF1 to γH2AX sites was analyzed by PLA in U2OS cells expressing HA-PCNA-WT or K164R with endogenous PCNA depleted by shRNA upon IR (4 Gy, 2 h after for PLA). Quantification of PLA foci per nucleus is displayed. Also see Supplementary Fig. 8g. (n = 296 cells). a to g: Three experiments were performed with ∼100 nuclei analyzed in each experiment. Quantification of PLA foci per nucleus from a total of ~300 nuclei are displayed. h A schematic drawing depicts GST-PCNA and GST-PCNA-Ub (top). Pull-down experiments were performed using GST-PCNA, GST-PCNA-Ub or GST and Flag-PIF1 expressing in 293 T cells. Anti-Flag Western blotting and Coomassie blue staining for GST proteins are shown (bottom). The relative fold of Flag-PIF1 Western signals over GST-PCNA or GST-PCNA-Ub is indicated as pull-down efficiency. i and j BIR frequency was determined in U2OS (EGFP-BIR/LTGC) cells expressing PCNA shRNA with vector as a control 5 days after I-Sce1 expression (i, left), or in cells expressing HA-PCNA-WT or HA-PCNA-K164R with endogenous PCNA depleted by shRNA, 5 days after I-Sce1 expression (i, right) or Cas9WT (j, left) and Cas9D10A (j, right) expression. (n = 5 replicates). Source data are provided as a Source data file.

