

Abstract
Masticatory muscle forces influence craniofacial morphology development. The antegonial notch (Notch) is a bony concavity on the inferior border of the mandible. Considering the Notch is located anteriorly to the insertion of the masseter muscle and varies among individuals, we hypothesised that these muscles influence the formation of the Notch. Therefore, this study aimed to investigate the correlation between mandible morphology and Notch formation. Sixty Japanese patients who visited the Department of Orthodontics at our university hospital were retrospectively evaluated. Morphological and morphometric analyses of the Notch and related craniofacial parameters were conducted using lateral cephalograms taken at the patients’ initial visits. Standard values for the Notch area and depth were determined, and the morphology of the Notch and mandible was analysed using Spearman’s rank correlation coefficient (p < 0.05). The mean Notch area and depth was 78.71 ± 36.54 mm2 and 3.11 ± 1.09 mm, respectively. The Notch area was significantly correlated with ramus inclination (p = 0.044, r = 0.261) and with the Y-axis (p = 0.039, r = 0.267). This study indicated that both the masticatory muscles and mandibular growth could contribute to the Notch formation.
Keywords: Antegonial notch, Masticatory muscle, Mandible, Mandibular growth
Subject terms: Anatomy, Medical research
Introduction
The influence of masticatory muscle activity on the development of craniofacial morphology has received considerable attention in the literature1. Via remodelling, the bone adapts to loads to reach the optimal form to withstand them (Wolff ’s law)2; therefore, some studies have reported that the craniofacial skeletal form is largely determined by mechanical loading3–5. For example, the masseter and medial pterygoid muscles have large cross sections in people with a short anterior face height and small gonial angle1,6–9.
The antegonial notch (Notch), also known as the gonial notch, pre-masseteric notch, or groove for facial vessels, is a unique characteristic of the mandible and bony concavity on the inferior border of the mandible, located anterior to the insertion of the masseter muscle10. It varies among individuals and could be deep, shallow, or even absent9,11,12.
During the development, the final position of the mandible may be determined by the following factors: mandibular length, which represents the magnitude, and Y-axis and ramus inclination, which indicates the direction of growth13,14. Previous studies have shown that the mandible undergoes forward and downward rotation during development7,15,16.
Considering the location of the Notch, attachment and retraction force of the masseter and medial pterygoid muscles, and direction of the mandibular growth, we hypothesised that the Notch is formed by the following two opposing mechanical forces: clockwise growth of the mandible and counterclockwise retraction force of the masticatory muscles, which elevate the inferior border of the mandible. Therefore, this study aimed to investigate the correlation between the mandibular growth and Notch formation, in order to reveal the influence of the muscles on Notch formation.
Materials and methods
Participants and eligibility
Sixty Japanese patients, comprising 30 men and 30 women aged between 18 and 60 (mean age: 19.2 ± 1.1) years who visited the Department of Orthodontics at our university hospital, were retrospectively evaluated. Morphological and morphometric analyses of the Notch and related craniofacial parameters were performed using lateral cephalograms obtained during the patients’ initial visits. Exclusion criteria were the history of craniofacial syndrome and previous orthodontic treatment. This study was designed following the recommendations of the Declaration of Helsinki from 1975 and subsequent revisions and was approved by the Institutional Review Board of the Research Ethics Committee (approval number: D2021-026) of Tokyo Medical and Dental University Hospital (Tokyo, Japan)). Informed consent was written from all either the study patients or the patient’s parents.
Lateral cephalometric radiographs and tracing
All lateral cephalometric radiographs were acquired in accordance with international standards. The patients’ heads were positioned with ear rods on cephalometric radiography, with the Frankfurt plane set horizontally. Additionally, the source-to-subject and subject-to-film distances were fixed in all cases. A board-certified orthodontist performed tracing and measurements (Fig. 1). The Y-axis and ramus inclination were measured as parameters of mandibular growth.
Fig. 1.
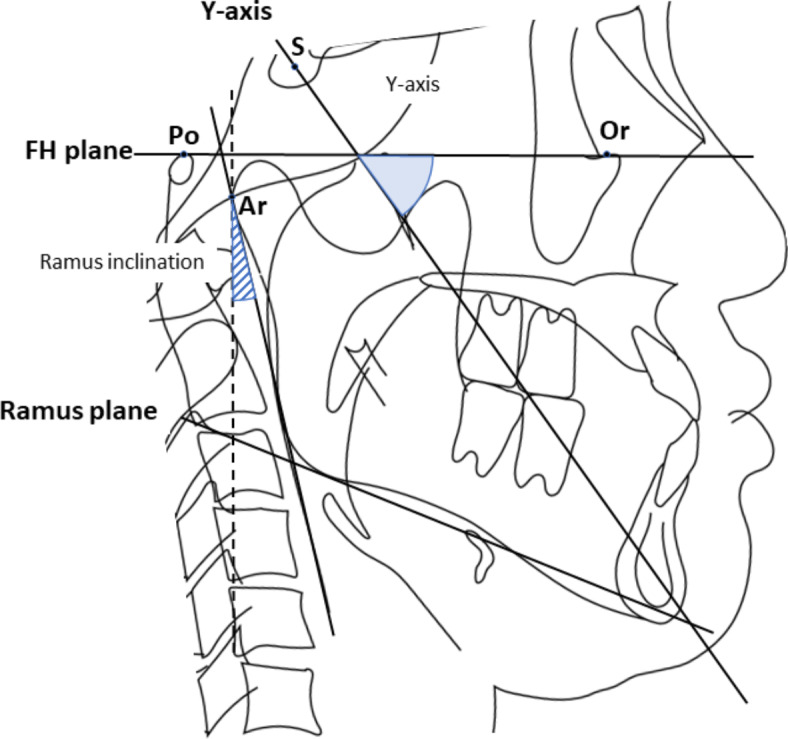
Landmarks and reference lines for cephalometric analysis. Abbreviations: S, Sera; Or, Orbitale; Po, Porion; Ar, Articulare; Gn, Gnathion; FH plane, Frankfurt plane; Y-axis, straight line passing through the S and Gn; Ramus plane, posterior plane of the mandible; Ramus inclination, angle formed by the ramus plane and a straight line perpendicular to the FH plane; Y-axis angle, Angle between Y-axis and FH plane.
Classification of the Notch
The Notch was classified based on a previous study by Porwolik et al.12 A tangential line was drawn to connect two points on the inferior border of the mandible (Fig. 2; points A and C). The area formed by the tangent and concave lines connecting points A and C was defined as the Notch. An imaginary line perpendicular to the tangent line (depth line) was drawn, and the intersecting points indicated the Notch depth. When the depth was greatest, the intersection points between the depth and tangent lines, as well as the depth and concave lines, were identified as points B and D, respectively. Subsequently, the Notch morphology was classified into three types as follows (Fig. 3): type 1: AB < 0.3*AC; type 2: 0.3*AC ≤ AB < 0.4*AC; and type 3: AB ≥ 0.4*AC. Types 1, 2, and 3 were defined as the asymmetrical posterior, symmetrical, and asymmetrical Notches, respectively. The area of the triangle (ACD; blue area in Fig. 2) was calculated as the notch area (mm2).
Fig. 2.
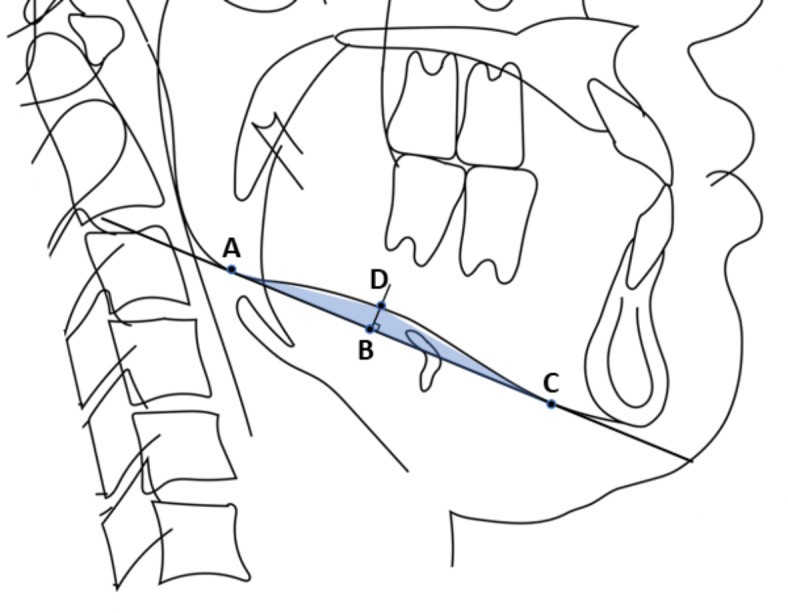
Definitions and measured sections of the antegonial notch (Notch). (A) The posterior border of the Notch; (B) extrapolated point of the position of the Notch fundus at its basis; (C) anterior border of the Notch; and (D) deepest point of the Notch.
Fig. 3.
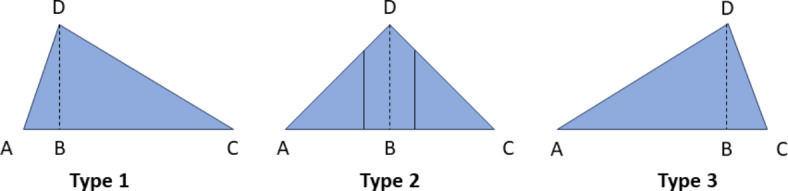
Classification of the Notch. Type 1: AB < 0.3*AC; type 2: 0.3*AC ≤ AB < 0.4*AC; and type 3: AB ≥ 0.4*AC.
Imaging analysis
Imaging analysis was performed using WinCeph ver. 11 (Rise Corp., Tokyo, Japan).
Correction of error
Twelve of the 60 patients (20%) were randomly selected and re-evaluated 2 months after the initial analysis. The second evaluation involved tracing and measurements. Furthermore, the Dahlberg error17 and concordance correlation coefficient were used to test intra-examiner reliability and agreement.
Sample size calculation
The ideal sample size was estimated using G*Power software (latest version 3.1.9.7), assuming a 5% significance level (α = 0.05), 95% confidence interval, 95% power, and effect size of 0.50, based on two-tailed tests. Accordingly, a minimum of 42 samples were required. Based on previous studies on mandibular bone morphologies18,19, we randomly collected 60 lateral cephalometric radiographs.
Statistical analysis
The Notch and mandible morphologies were analysed using Spearman’s rank correlation coefficient (p < 0.05). Statistical analyses were performed using IBM SPSS Statistics for Windows, version 29 (IBM Corp., Armonk, N.Y., USA). The ANB angle was used as a parameter to show the absence of deviation in craniofacial morphology, and the Shapiro–Wilk normality test was performed (p < 0.05).
Results
Measurement error
The Dahlberg error was minimal for all variables, and the concordance correlation coefficient indicated excellent intra-examiner reliability and agreement.
Tracing and measurement of lateral cephalometric radiographs
Cephalometric analysis revealed that the average ANB and SNB angles in this sample were 2.5 ± 3.9° and 78.8 ± 4.5°, respectively (Table 1). The average values of the ramus inclination angle and Y-axis were 10.6 ± 3.1° and 63.5 ± 4.7°, respectively. Additionally, the average ANB value was within the normal range and showed a normal distribution in the Shapiro–Wilk normality test (p = 0.080). The average Notch area and depth was 78.7 ± 36.5 mm2 and 3.1 ± 1.1 mm, respectively. A significant correlation was observed between the Notch area and ramus inclination (p = 0.044, r = 0.261) (Fig. 4), and between the Notch area and Y-axis (p = 0.039, r = 0.267) (Fig. 5).
Table 1.
Study population.
| ANB | SNB | Ramus inclination |
Y-axis | |
|---|---|---|---|---|
|
Average ± S.D.(°) |
2.5 ± 3.9 | 78.8 ± 4.5 | 10.6 ± 3.1 | 63.5 ± 4.7 |
|
Normal ± S.D.(°) |
3.4 ± 1.8 | 78.9 ± 3.5 | 2.9 ± 4.4 | 65.4 ± 5.6 |
ANB, angle formed by line A-N and line B-N; SNB, angle formed by S-N and line B-N; SD, standard deviation: Norm, Janapanese Standard value.
Fig. 4.
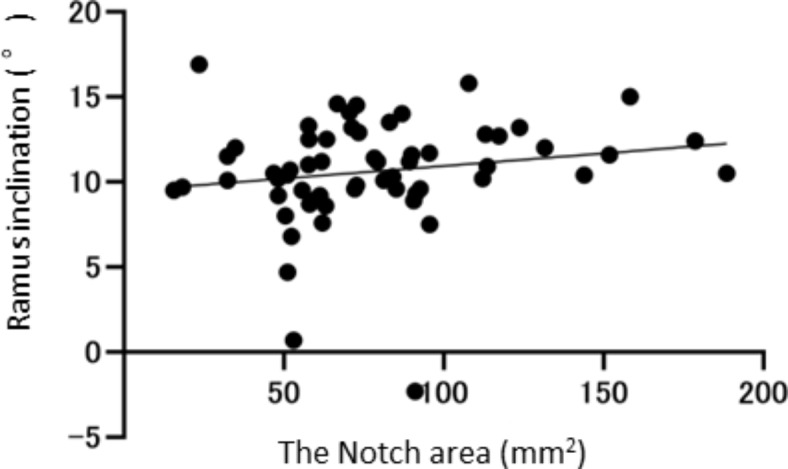
Correlations between the Notch area and ramus inclination.
Fig. 5.
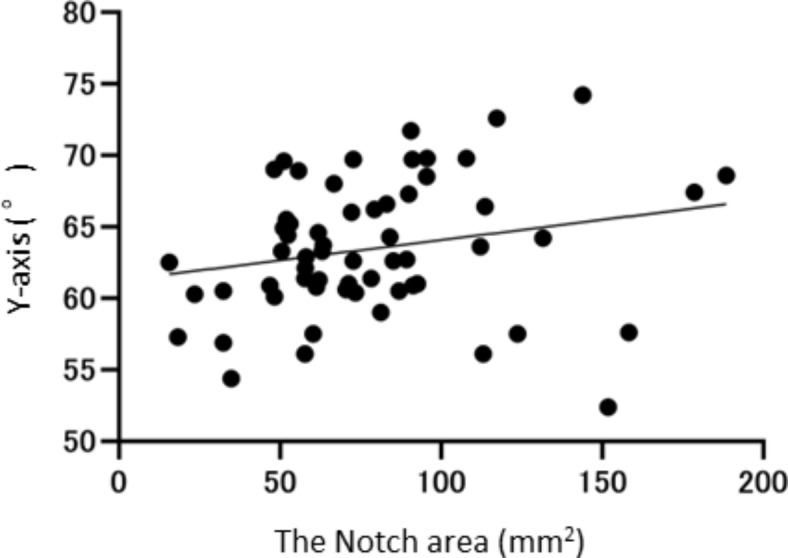
Correlations between the Notch area and Y-axis.
Classification of the Notch
Types 1, 2, and 3 comprised 25 (42%, male: female = 16:9), 29 (48%, male: female = 12:17), and 6 (10%, male: female = 2:4) cases, respectively (Table 2).
Table 2.
Classification of subjects in type 1,2, and 3 according notch form.
| Male | Female | Total | |
|---|---|---|---|
| Type 1 | 16(53%) | 9(30%) | 25(42%) |
| Type2 | 12(40%) | 17(57%) | 29(48%) |
| Type 3 | 2(7%) | 4(13%) | 6(10%) |
| Total | 30 | 30 | 60 |
Discussion
We found that, in the vast majority of cases, the apex of the notch was located posteriorly in the classification of Notch shape, with types 1 and 2 accounting for 90% of cases. This might be related to the direction of the retraction force of the masseter and medial pterygoid muscles. The notch area correlated with the ramus inclination and Y-axis. Therefore, the Notch area may indicate the direction of mandibular growth, given that the ramus inclination and Y-axis are indicators of antero-inferior mandibular growth.
Accurate prediction of mandibular growth holds significant clinical value. Previous studies have assessed various factors and methods for predicting mandibular growth. Two studies also explored the possibility that mandibular Notch morphology may predict mandibular growth8,20. However, some studies have refuted that Notch depth provides a sufficient indication of future facial growth19,21. Previous studies on these predictors only examined their correlation with the amount and direction of mandibular growth, rather than considering how Notch is formed8,19–21. The masticatory muscles, specifically the masseter and medial pterygoid muscles, attach to and elevate the angle of the mandible. Additionally, the direction of mandibular growth is generally antero-inferior7,15,16. Formation of the Notch, located anterior to the attachment of the masseter muscle, is mainly influenced by two factors: direction of mandibular growth and retraction force of the masseter and medial pterygoid muscles. This is evidenced by the absence of a Notch on the foetal mandible22. The mandibular growth in inferior direction and retraction force in superior direction could be related to the length of the Notch. More retraction force of the muscles in anterior direction could form the deeper Notch. Therefore, Notch morphology could predict the influence of retraction force of the masticatory muscle on mandibular growth. Even after completion of the mandibular growth, the mandible could still be retracted by the muscles in anterior direction in case of deep Notch. This could be useful to quantitate the retraction force of the muscles in anterior direction which might potentially cause anterior disposition of the mandible or other bony changes in and around the angle of the mandible.
This study had some limitations. First, we conducted a two-dimensional evaluation that is routinely used for orthodontic diagnoses rather than a three-dimensional evaluation. Second, this study was a cross-sectional survey; therefore, a future longitudinal survey is necessary to examine growth at the individual level.
Conclusions
We highlighted the relationship between the Notch area and the direction of mandibular growth. In addition, retraction force of the masticatory muscles might influence the Notch shape. Therefore, both the masticatory muscles and mandibular growth could contribute to the Notch formation, although further investigations of growth period cases and longitudinal surveys are required to validate these findings.
Author contributions
A.M., K.F., Y.K., N.K., J.I., and T.O. designed and summarized this study. A.M., K.F., Y.K., and N.K. performed data extraction, analysed the results. A.M., and K.F. wrote the main manuscript text. J.I., and T.O. checked the study design and approved the final manuscript as submitted. A.M., and K.F. reviewed and revised the manuscript, and approved the final manuscript as submitted. All authors read and approved the final version of the manuscript.
Funding
This study did not receive specific grants from public, commercial, or non-profit funding agencies.
Data availability
The data underlying this article are available in Zenodo at 10.5281/zenodo.11188875.
Declarations
Competing interests
The authors declare no competing interests.
Footnotes
Publisher’s note
Springer Nature remains neutral with regard to jurisdictional claims in published maps and institutional affiliations.
References
- 1.Pepicelli, A., Woods, M. & Briggs, C. The mandibular muscles and their importance in orthodontics: A contemporary review. Am. J. Orthod. Dentofac. Orthop.128, 774–780 (2005). [DOI] [PubMed] [Google Scholar]
- 2.Kiliaridis, S. Masticatory muscle influence on craniofacial growth. Acta Odontol. Scand.53, 196–202 (1995). [DOI] [PubMed] [Google Scholar]
- 3.Moss, M. L. & Salentijn, L. The primary role of functional matrices in facial growth. Am. J. Orthod.55, 566–577 (1969). [DOI] [PubMed] [Google Scholar]
- 4.Proffit, W. R., Fields, H. W. & Nixon, W. L. Occlusal forces in normal- and long-face adults. J. Dent. Res.62, 566–570 (1983). [DOI] [PubMed] [Google Scholar]
- 5.Kiliaridis, S. Muscle function as a determinant of mandibular growth in normal and hypocalcaemic rat. Eur. J. Orthod.11, 298–308 (1989). [DOI] [PubMed] [Google Scholar]
- 6.Cangialosi, T. J. Skeletal morphologic features of anterior open bite. Am. J. Orthod.85, 28–36 (1984). [DOI] [PubMed] [Google Scholar]
- 7.Björk, A. Prediction of mandibular growth rotation. Am. J. Orthod.55, 585–599 (1969). [DOI] [PubMed] [Google Scholar]
- 8.Singer, C. P., Mamandras, A. H. & Hunter, W. S. The depth of the mandibular antegonial notch as an indicator of mandibular growth potential. Am. J. Orthod. Dentofac. Orthop.91, 117–124 (1987). [DOI] [PubMed] [Google Scholar]
- 9.Mączka, G. et al. Morphology of the antegonial notch and its utility in the determination of sex on skeletal materials. J. Anat.241, 919–927 (2022). [DOI] [PMC free article] [PubMed] [Google Scholar]
- 10.Kitagawa, N. et al. The notch of the mandible: What do different fields call it? Anat. Cell. Biol.56, 308–312 (2023). [DOI] [PMC free article] [PubMed] [Google Scholar]
- 11.Schütz, C. et al. Mandibular antegonial notch depth in postpubertal individuals: A longitudinal cohort study. Clin. Exp. Dent. Res.8, 923–930 (2022). [DOI] [PMC free article] [PubMed] [Google Scholar]
- 12.Porwolik, M. et al. Typology of the antegonial notch in the human mandible. Folia Morphol.74, 365–371 (2015). [DOI] [PubMed] [Google Scholar]
- 13.Parrish, M. et al. Short- and long-term prediction of the post-pubertal mandibular length and Y-Axis in females utilizing machine learning. Diagnostics (Basel). 13, 2729 (2023). [DOI] [PMC free article] [PubMed] [Google Scholar]
- 14.Roy, P., Roy, P. & Koley, S. Comparative assessment of various cephalometric parameters used for determining vertical skeletal dysplasia. Cureus16, e55101 (2024). [DOI] [PMC free article] [PubMed] [Google Scholar]
- 15.Bjork, A. Variations in the growth pattern of the human mandible: Longitudinal radiographic study by the implant method. J. Dent. Res.42 (1Pt 2), 400–411 (1963). [DOI] [PubMed] [Google Scholar]
- 16.Björk, A. & Skieller, V. Normal and abnormal growth of the mandible. A synthesis of longitudinal cephalometric implant studies over a period of 25 years. Eur. J. Orthod.5, 1–46 (1983). [DOI] [PubMed] [Google Scholar]
- 17.Dahlberg, G. Standard error and medicine. Acta Genet. Stat. Med.1, 313–321 (1949). [DOI] [PubMed] [Google Scholar]
- 18.Marolt, C. et al. Key anatomical clarifications for the marginal mandibular branch of the facial nerve: Clinical significance for the plastic surgeon. Aesthet. Surg. J.41, 1223–1228 (2021). [DOI] [PubMed] [Google Scholar]
- 19.Kolodziej, R. P. et al. Evaluation of antegonial notch depth for growth prediction. Am. J. Orthod. Dentofac. Orthop.121, 357–363 (2002). [DOI] [PubMed] [Google Scholar]
- 20.Lambrechts, A. H. et al. Dimensional differences in the craniofacial morphologies of groups with deep and shallow mandibular antegonial notching. Angle Orthod.66, 265–272 (1996). [DOI] [PubMed] [Google Scholar]
- 21.Davidovitch, M. et al. The use of Bjork’s indications of growth for evaluation of extremes of skeletal morphology. Eur. J. Orthod.38, 555–562 (2016). [DOI] [PubMed] [Google Scholar]
- 22.Sato, I. et al. Morphology and analysis of the development of the human temporomandibular joint and masticatory muscle. Acta Anat. (Basel). 149, 55–62 (1994). [DOI] [PubMed] [Google Scholar]
Associated Data
This section collects any data citations, data availability statements, or supplementary materials included in this article.
Data Availability Statement
The data underlying this article are available in Zenodo at 10.5281/zenodo.11188875.