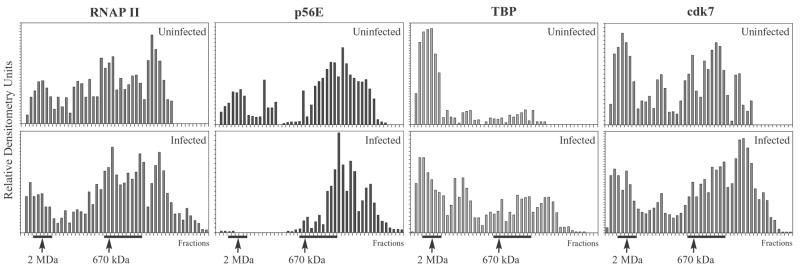
FIG. 3.
Elution profiles of RNAP II and GTFs from Sepharose CL-2B gel filtration chromatography. Nuclear extracts from uninfected cells or cells infected with HSV-1 were chromatographed and analyzed by immunoblotting, as described in the legend to Fig. 2. The intensity of each band was quantitated by densitometry. Densitometer readings were normalized against identical standards on each gel (20 μg of infected or uninfected nuclear extract) and expressed as relative densitometry units. Relative densitometry units were plotted against fraction number. Positions of 2-MDa and 670-kDa molecular standards are indicated. Horizontal lines below graphs indicate fractions at ∼2 MDa and ∼670 kDa that were pooled for GST-TFIIS affinity chromatography and in vitro transcriptions (Fig. 4, 6, 7, and 10).

