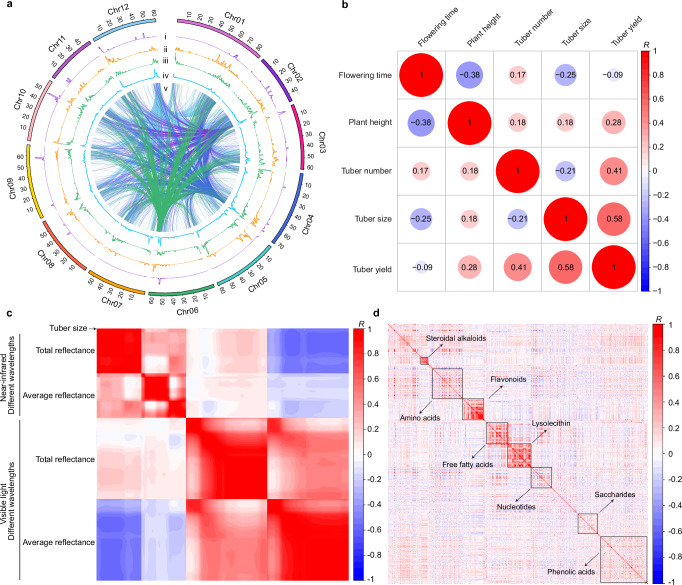
Fig. 2. Overview of QTLs at the whole genome and correlation of different traits.
a QTL distribution analyzed by sliding windows with 1-Mb window and 100-kb step sizes. The y-axis of i–iv indicates QTL number. i, pQTLs; ii, mQTLs; iii, local eQTLs; iv, distant eQTLs; v, the regulatory network of distant eQTL hotspots. b Correlation of tuber yield-related traits in 2021. c Correlation of tuber size and tuber reflectance. The first row concerns tuber size, indicated by the arrow. d Correlation of metabolites. Different kinds of metabolites can be separated by their levels of correlation (R). The x and y axes indicate different kinds of metabolites. In (b–d), red indicates positive and blue indicates negative correlations. Source data are provided as a Source Data file.

