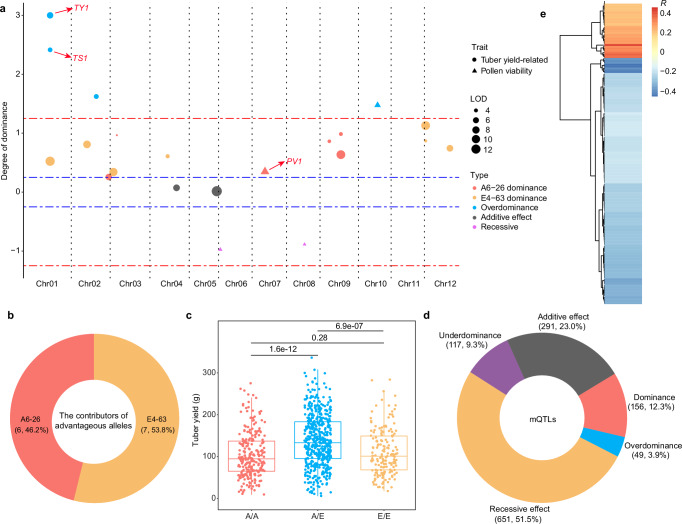
Fig. 4. Single-locus effects of heterosis in the diploid hybrid.
a The heterotic effects of yield and pollen viability QTLs. The y axis indicates d/a values; d/a values > 3 are displayed as 3. The red dotted line indicates ±1.25 and the dotted blue lines indicate ±0.25. Data from 2021 were used. b The contributor (parental) source of advantageous alleles in hybrid potato. c The yield of different genotypes of TY1 in 2021. A/A, the A6-26 homozygous genotype (A6-26/A6-26); A/E, the heterozygous genotype (A6-26/E4-63); E/E, the E4-63 homozygous genotype (E4-63/E4-63); n = 253, 498 and 163 for A/A, A/E and E/E, respectively. The upper and lower edges of the boxes denote 75% and 25% quartiles, and the central line indicates the median. Whiskers extend to the lower hinge –1.5× interquartile range and upper hinge +1.5× interquartile range of the data. P values are obtained by Student’s t tests (two-tailed). d The proportion of different genetic effects of mQTLs. The numbers in parentheses refer to QTL numbers and percentages. e Correlations (R) between dry matter and metabolites with p-values < 0.01. P values are computed with Pearson correlation tests. Source data are provided as a Source Data file.

