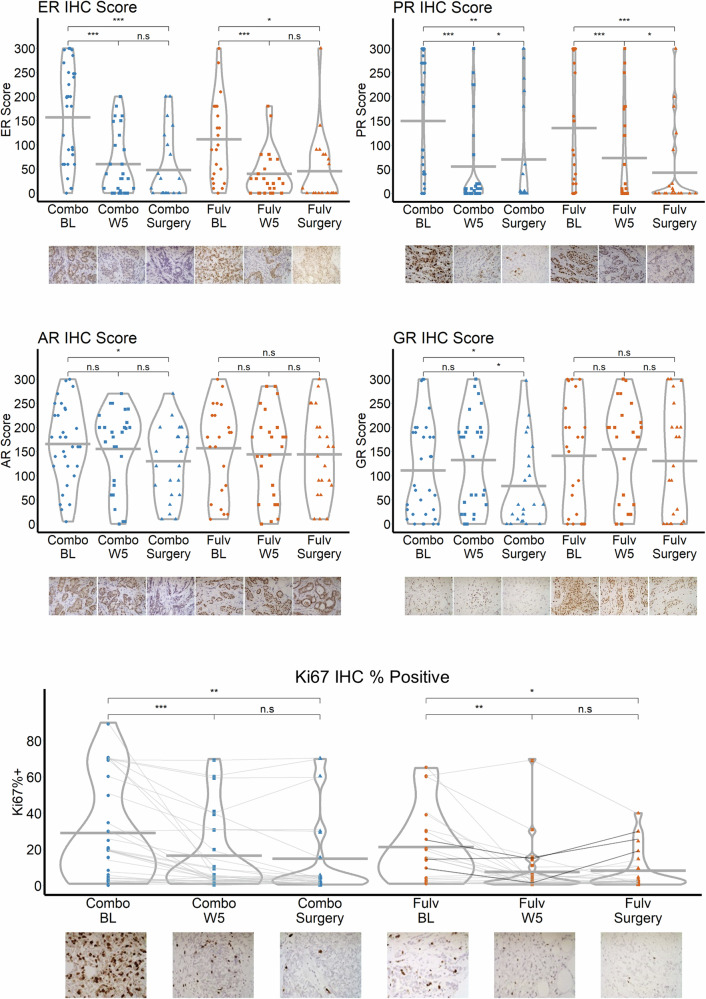
Fig. 2. Immunohistochemistry (IHC) in serial biopsies by treatment arm and time.
Points represent individual observations and horizontal lines indicate the mean in each group. T-tests were used to compare the Combo and Fulv arms for each outcome and time point. Paired t-tests were used to evaluate within-group changes over time. “n.s.,” “*,” “**,” and “***” indicate non-significance (p > 0.05), p < 0.05, p < 0.01, and p < 0.001, respectively. Images of one patient’s paired samples over time are shown for each protein under the x-axis as an example. Data points in the Ki67 plot are vertically jittered up to one unit. Magnification = 400×.

