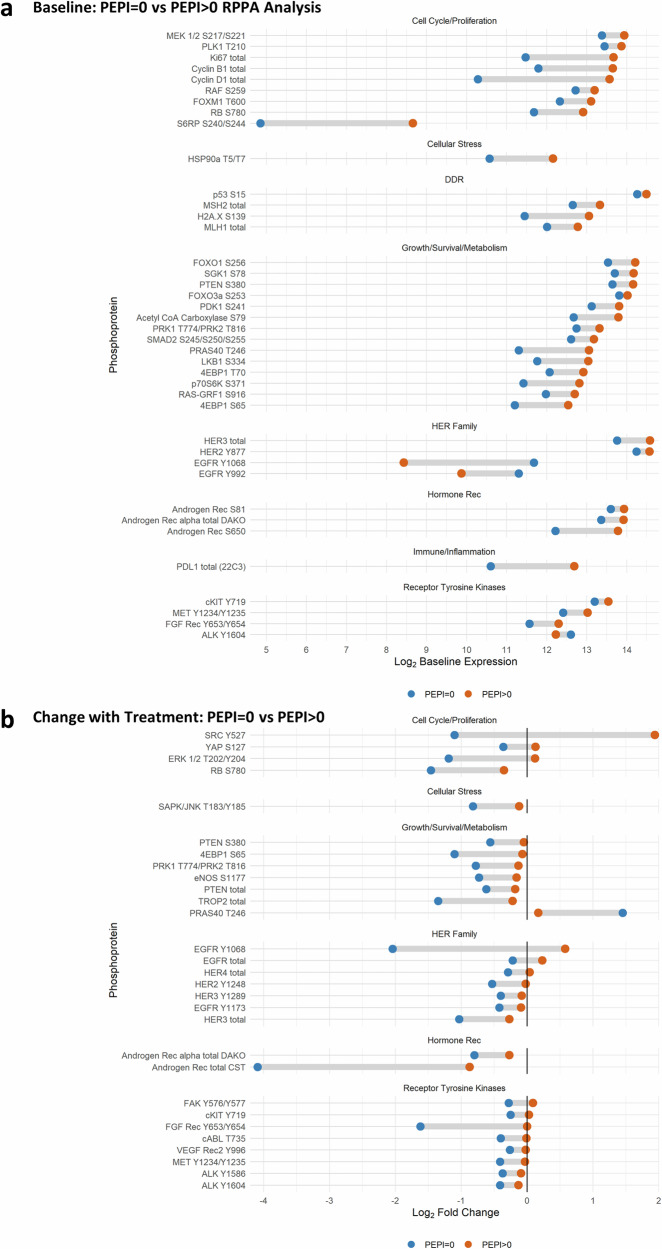
Fig. 3. RPPA by PEPI score.
Reverse-phase phosphoprotein analysis (RPPA) was performed on laser-captured, fresh frozen tumor that was split into two groups for comparison: PEPI = 0 (blue, N = 9) tumors that responded to treatment, and PEPI > 0 (orange, N = 45) tumors that did not. Tumors came from patients in both arms. Presented phosphoproteins were significantly (p < 0.1) differentially expressed by the Empirical Bayes moderated t-test. a Dumbbell plot of the mean log2 baseline expression for patients with PEPI = 0 and PEPI > 0 for each significant phosphoprotein. b Dumbbell plot of the mean log2 change in expression among patients with PEPI = 0 and PEPI > 0 for each significant phosphoprotein.

