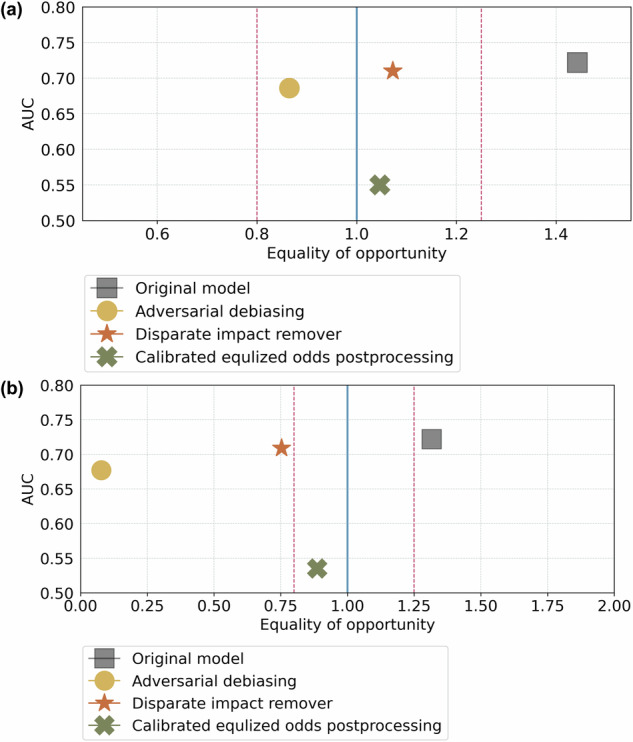
Fig. 6. NHB (protected group) vs. NHW (privileged group) and Hispanic vs. NHW, respectively.

The ideally fair line is represented by the blue line, while the range of statistically fair is shown by the red dots. the ridge regression model initially fell outside the range of statistically fair but became fairer when we employed the fairness issue mitigation methods CEP, DIR, and ADB, resulting in equal opportunity regarding FNR ratio. a Mitigation results on the NHB vs NHW. CEP had the best fairness issue mitigation ability but led to a drastic decrease in model performance from 0.722 to 0.550, measured by AUROC, which is unacceptable. DIR and ADB resulted in an acceptable decrease in prediction performance, particularly with DIR’s AUROC decreasing from 0.722 to 0.710. b Mitigation results on the Hispanic vs NHW. DIR and ADB struggled to handle the fairness issue mitigation. These methods turned to favoritism towards the protected group (Hispanic), resulting in biased predictions for the NHW group.
