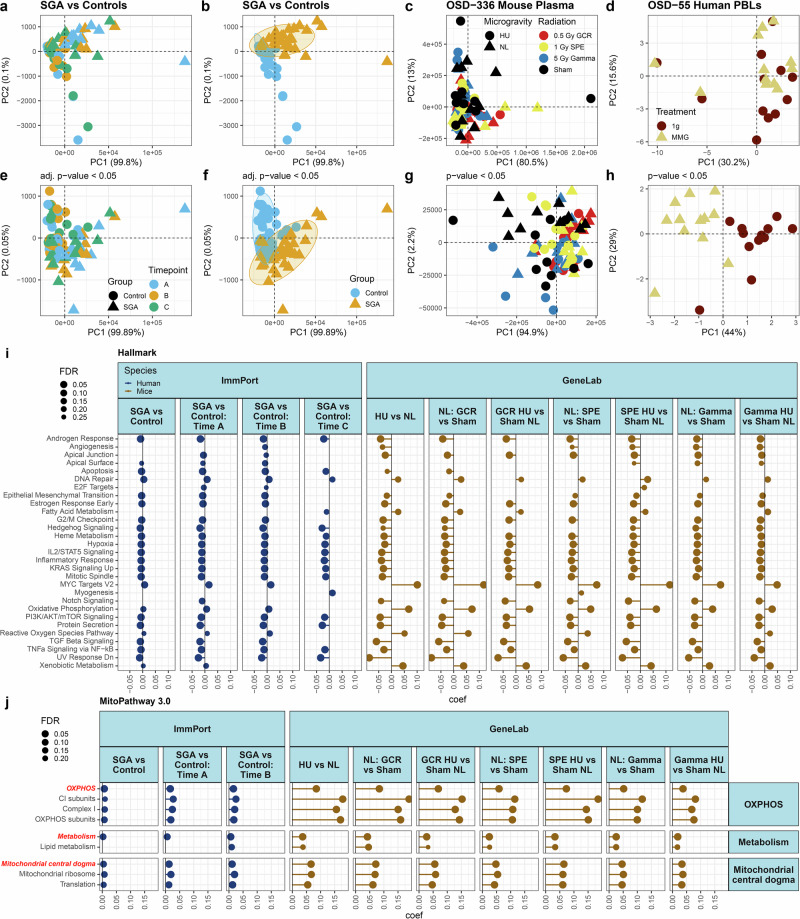
Fig. 1. The global response of miRNA expression comparing SGA patients to controls and spaceflight samples to controls and the core pathways being influenced.
Principal Component Analysis (PCA) plots demonstrate the clustering of the samples for each group. a Comparative miRNA expression analysis between Small for Gestational Age (SGA) patients (triangles) and control (healthy) patients (circles) at three distinct time-points: A ( weeks) (blue), B ( weeks) (yellow), and C ( weeks) (green). Individual timepoint PCA plots can be found in Supplementary Fig. 1. For all SGA analysis there were a total of N = 29 patients included in the study with N = 16 normal birth outcomes and N = 13 SGA births for each time point. b miRNA expression PCA plots comparing SGA and control patients, irrespective of time. c miRNA expression clustering of OSD-336 mouse plasma under various treatments: 0.5 Gy Galactic Cosmic Radiation (GCR, red), 1 Gy Solar Particle Event (SPE, yellow), 5 Gy Gamma radiation (blue), and Sham (black); in both microgravity (circles) and normal gravity (triangles). Individual radiation-type PCA plots can be found in Supplementary Fig. 2. d miRNA expression analysis of OSD-55 human peripheral blood leukocytes (PBLs) under normal Earth gravity (circles) and microgravity (triangles). e miRNA expression analysis comparing SGA patients and control patients at three different time-points: A, B, and C, focusing exclusively on significant genes (p < 0.05). f Time-independent analysis of significant miRNAs differences (p < 0.05) between SGA and control patients. g Significant miRNA expression analysis (p < 0.05) of OSD-336 mouse plasma under different simulated radiation and microgravity conditions. h Significant miRNA expression analysis (p < 0.05) of OSD-55 human PBLs under microgravity and normal gravity conditions. Gene set analysis of miRNAs on common (i) Hallmark pathways and (j) MitoPathways in SGA and simulated spaceflight pathways compared to control, using the Molecular Signatures Database (MSigDB) Hallmark pathways to assess miRNA expressions impact on these pathways and functions. SGA human miRNA regulation is compared to control both time-independently and at different timepoints (left). Space radiation miRNAs with and without simulated microgravity are compared to Sham (right). The x-axis represents a coefficient term indicating pathway inhibition (negative value) or activation (positive value). The point size indicates the degree of significance, denoted by False Discovery Rate (FDR). Only significant values (FDR < 0.25) are displayed. The full list of significantly regulated pathways can be found in Supplementary Figs. 3 and 4.

