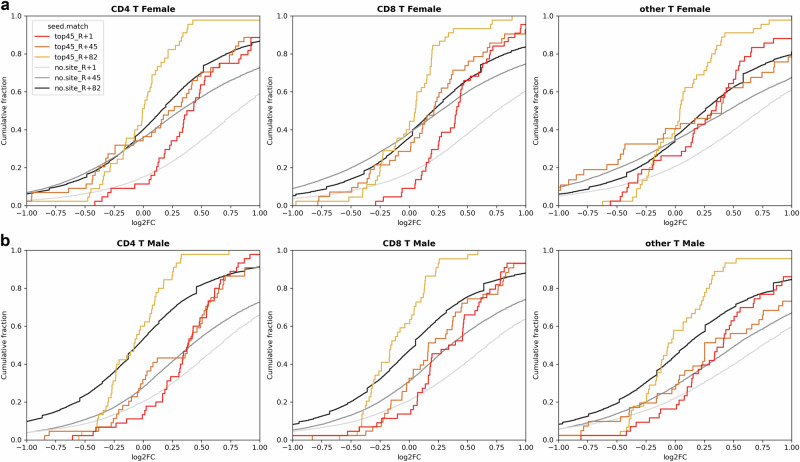
Fig. 7. Sex-specific cumulative plots illustrate the impact on the top 45 gene targets of 13 specific miRNAs in Inspiration 4 (I4) astronaut data, derived from scRNA-sequence analysis of whole blood.
These cumulative plots focus on T cells (i.e., CD4 and CD8 T cells and others) in the I4 astronaut scRNA-seq data, comparing 1 day after return to Earth (R1) (red line), 45 days after return to Earth (R45) (orange line), and 82 days after return to Earth (R82) (gold line) to pre-flight levels. The x-axis represents log2(fold-change) values for the comparisons, while the “no-site” line serves as a baseline for genes without targets to the 13 miRNAs. Various shades of gray in the no-site lines correspond to specific comparisons, as indicated in the figure legend. a Cumulative plots specifically for the female astronauts. b Cumulative plots specifically for the male astronauts.

