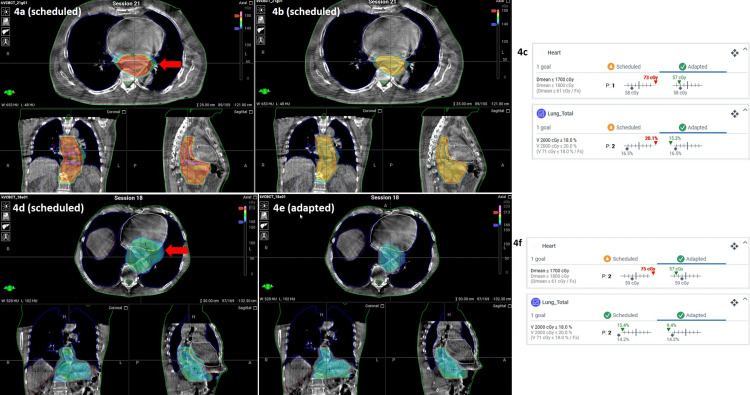
Figure 4. Comparison of radiation dose to the heart and lungs between scheduled and adapted plans for Patient 1 and Patient 2, with areas of excessive dose marked by red arrows.
Patient 1: Comparison between scheduled plan (4a) and adapted plan (4b) for radiation dose to the heart and to the lungs by a single fraction. Areas of excessive dose are marked with a red arrow. Values from DVH for the dose to OARs (4c).
Patient 2: Comparison between scheduled plan (4d) and adapted plan (4e) for radiation dose to the heart and to the lungs by a single fraction. Areas of excessive dose are marked with a red arrow. Values from DVH for dose to OARs (4f).
DVH: Dose-volume histogram; OARs: Organs at risk

