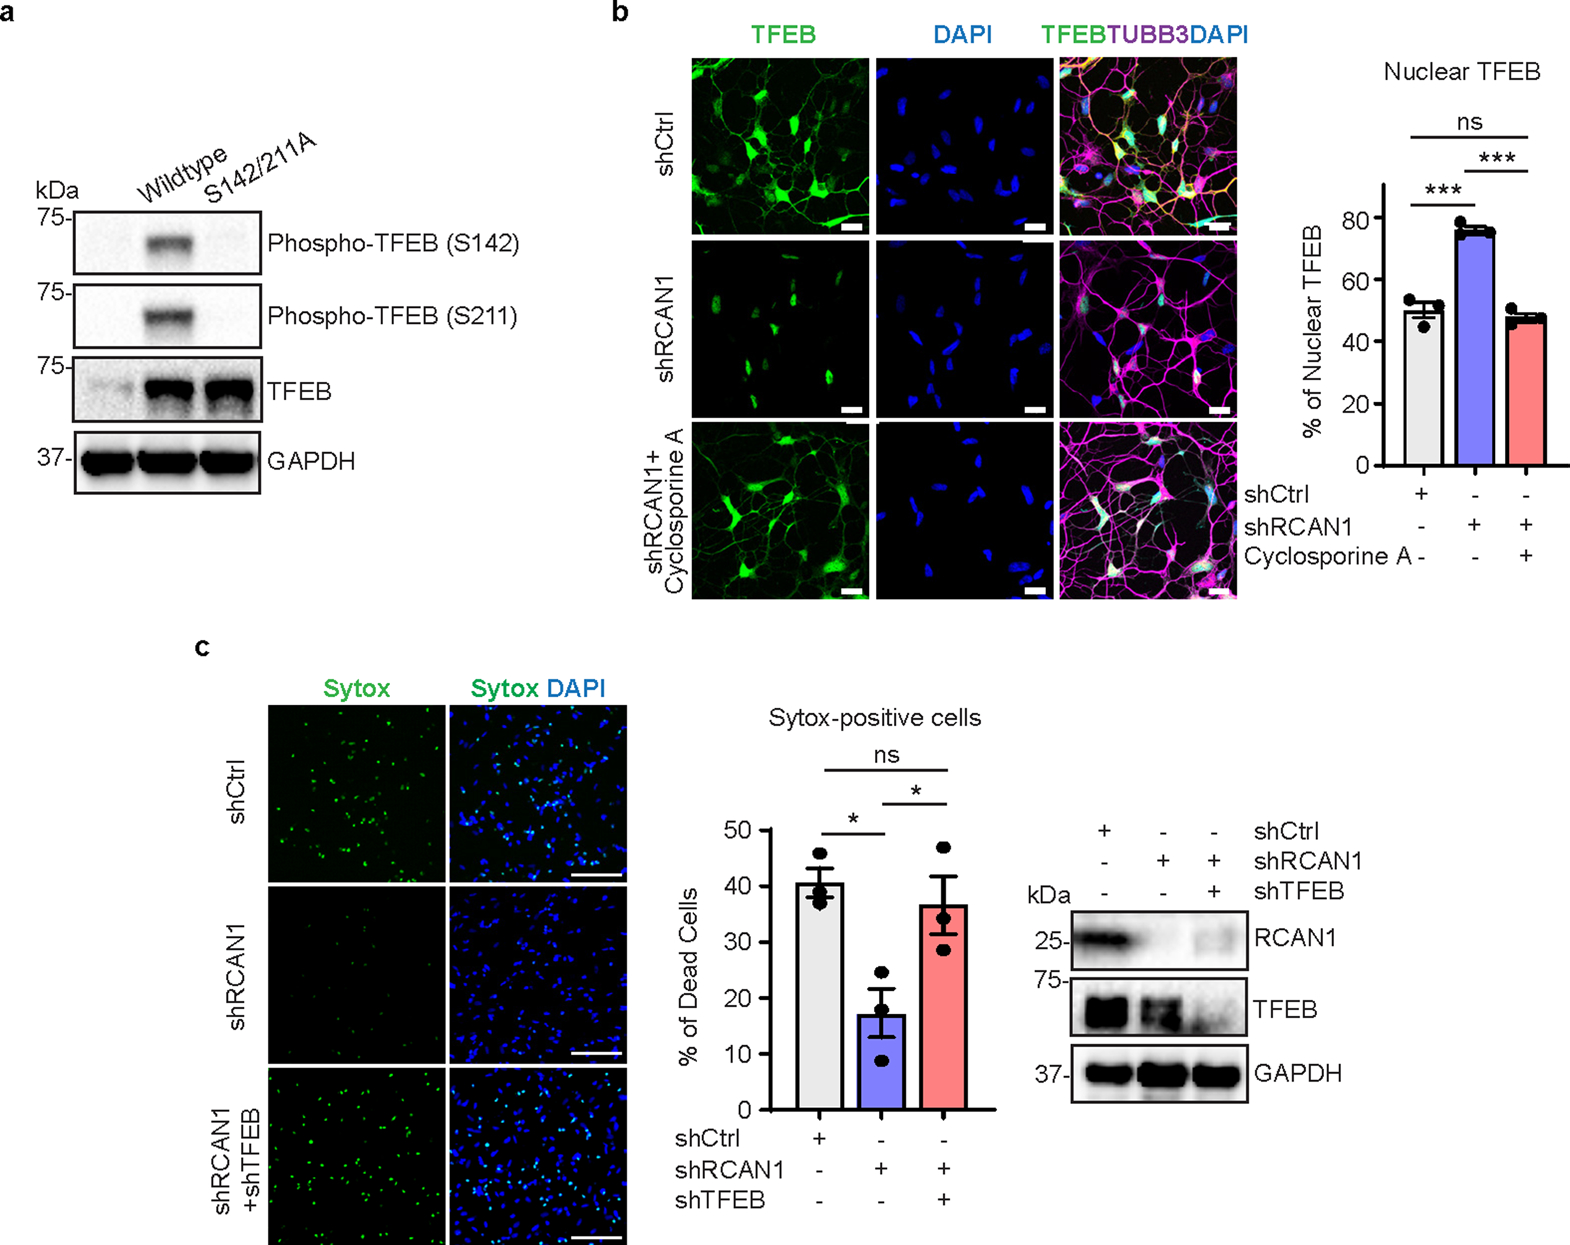
Extended Data Fig. 5 |. RCAN1 promotes nuclear localization of TFEB for HD survival.

a, Expression of phosphor-TFEB in fibroblasts transduced with Control, TFEB wildtype, or phosphor-mutant (S142/211 A). b. Representative image (left) and quantification of nuclear TFEB from three independent HD-MSNs (HD.45, HD.45b, HD.47) transduced with shCtrl or shRCAN1. Cells were treated with DMSO or Cyclosporin A (CaN inhibitor) (n = 3). shCtrl versus shRCAN1 ***p = 0.0002, shRCAN1 versus shRCAN1+Cyclosporin A ***p = 0.0001. c, Representative image (left) and quantification of Sytox-positive cells (middle) from three independent HD-MSNs (HD.45, HD.45b, HD.47) transduced with shCtrl, shRCAN1, or shTFEB. Expression of RCAN1 and TFEB in HD-MSNs transduced with shCtrl, shRCAN1, or shTFEB (right) (n = 3). Statistical significance was determined using one-way ANOVA with Tukey’s post hoc test (b,c); ***p < 0.001, *p < 0.05, ns, not significant, and mean±s.e.m (b,c). The sample size (n) corresponds to the number of biologically independent samples (b,c).
