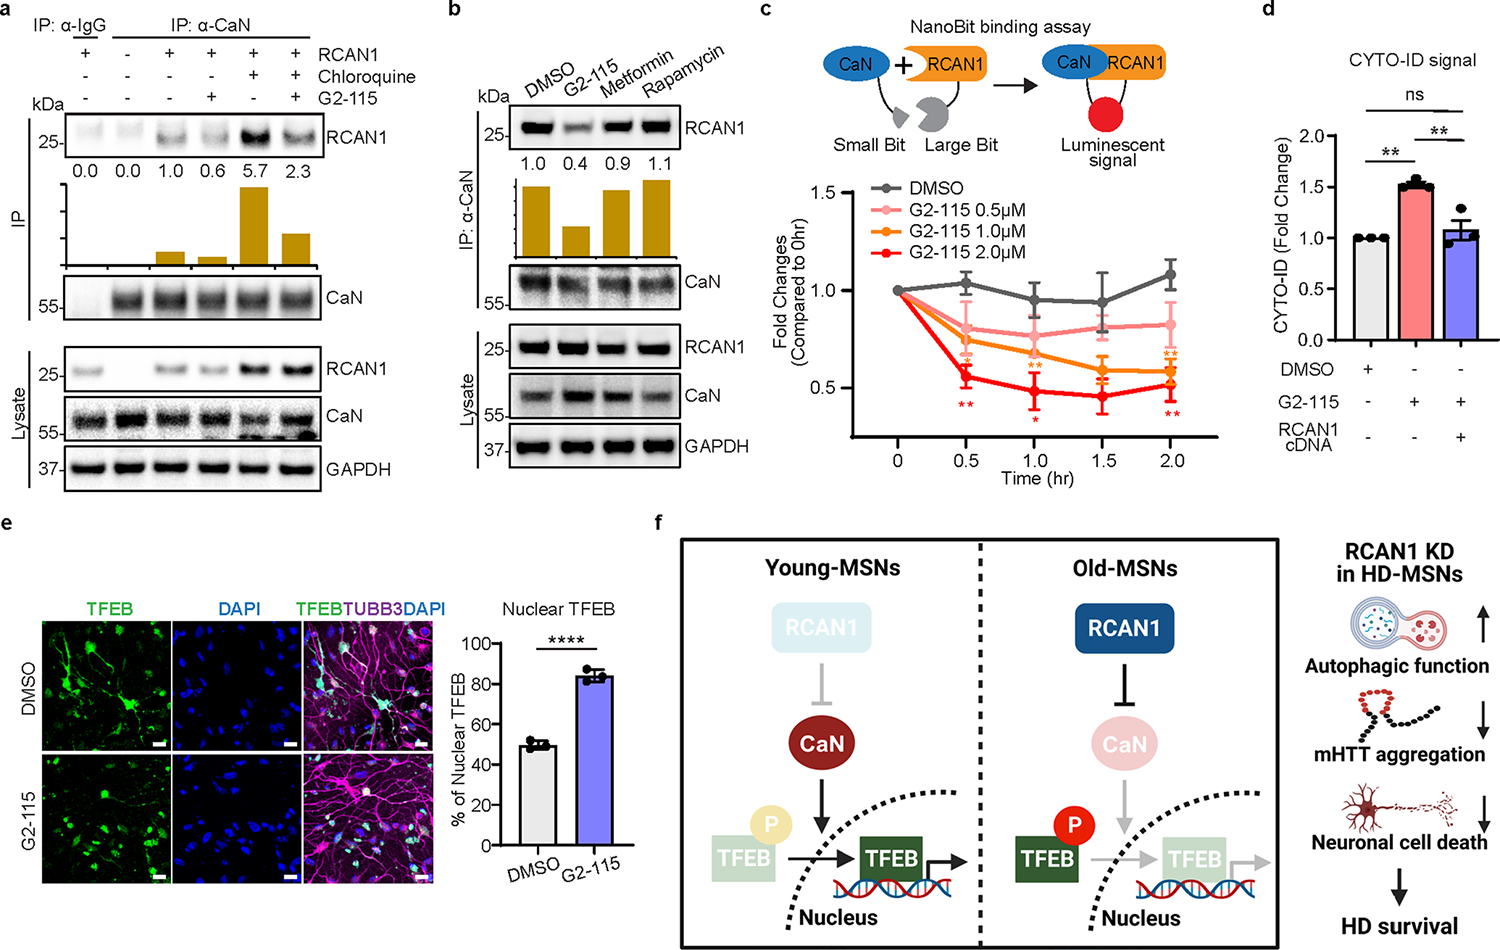
Extended Data Fig. 6 |. Neuroprotective role of G2–115 through reducing RCAN1-CaN interaction.

a, Immunoprecipitation analysis of RCAN1-transduced fibroblasts with anti-CaN antibody followed by immunoblotting with anti-RCAN1 antibody. Cells are treated with 0.5 μM of G2–115 and 60 μM of chloroquine (lysosome inhibitor). b, Immunoprecipitation analysis of RCAN1-transduced fibroblasts with anti-CaN followed by immunoblotting with anti-RCAN1 antibody. Cells were treated with DMSO or 0.5 μM of G2–115, 8 mM of metformin, and 500 nM of rapamycin. c, Experimental scheme of NanoBit binding assay (top). Binding assay of HEK293 cells transfected with RCAN1 fused to large Bit and CaN fused to small Bit. Cells were treated with 0.5, 1.0, 1.5, and 2.0 μM of G2–115 in a dose-dependent manner (bottom). (n = 3, The sample size (n) corresponds to the number of independent experiments). DMSO versus G2–115 1.0 μM 0.5 hr *p = 0.0379, 1.0 hr **p = 0.0091, 2.0 hr **p = 0.0082, DMSO versus G2–115 2.0 μM 0.5 hr **p = 0.0044, 1.0 hr *p = 0.0230, 2.0 hr **p = 0.0084. d, Quantification of CYTO-ID-positive cells from three independent HD-MSNs (HD.45, HD.45b, HD.47) treated with DMSO or G2–115. Cells were transduced with RCAN1 (n = 3). DMSO versus G2–115 **p = 0.0025, G2–115 versus G2–115 + RCAN1 cDNA **p = 0.0060. e, Representative image (left) and quantification (right) of nuclear TFEB from three-independent HD-MSNs (HD.45, HD.45b, HD.47) treated with DMSO or G2–115. Cells were immunostained with anti-TFEB and TUBB3 antibodies. An average of 107 cells per each were counted from three or more randomly chosen fields (n = 3, ****p < 0.0001). Scale bars represent 20 μm. f, Graphical work model to illustrate the function of RCAN1-CaN-TFEB cascade in Young/Old-MSNs (left) and the neuroprotective role of RCAN1 KD for HD survival. Statistical significance was determined using one-way ANOVA with Tukey’s post hoc test in (d) and two-tailed unpaired t-test (c,e); ****p < 0.0001, **p < 0.01, *p < 0.05, ns, not significant, and mean±s.e.m (c-e). The sample size (n) corresponds to the number of biologically independent samples (d,e).
