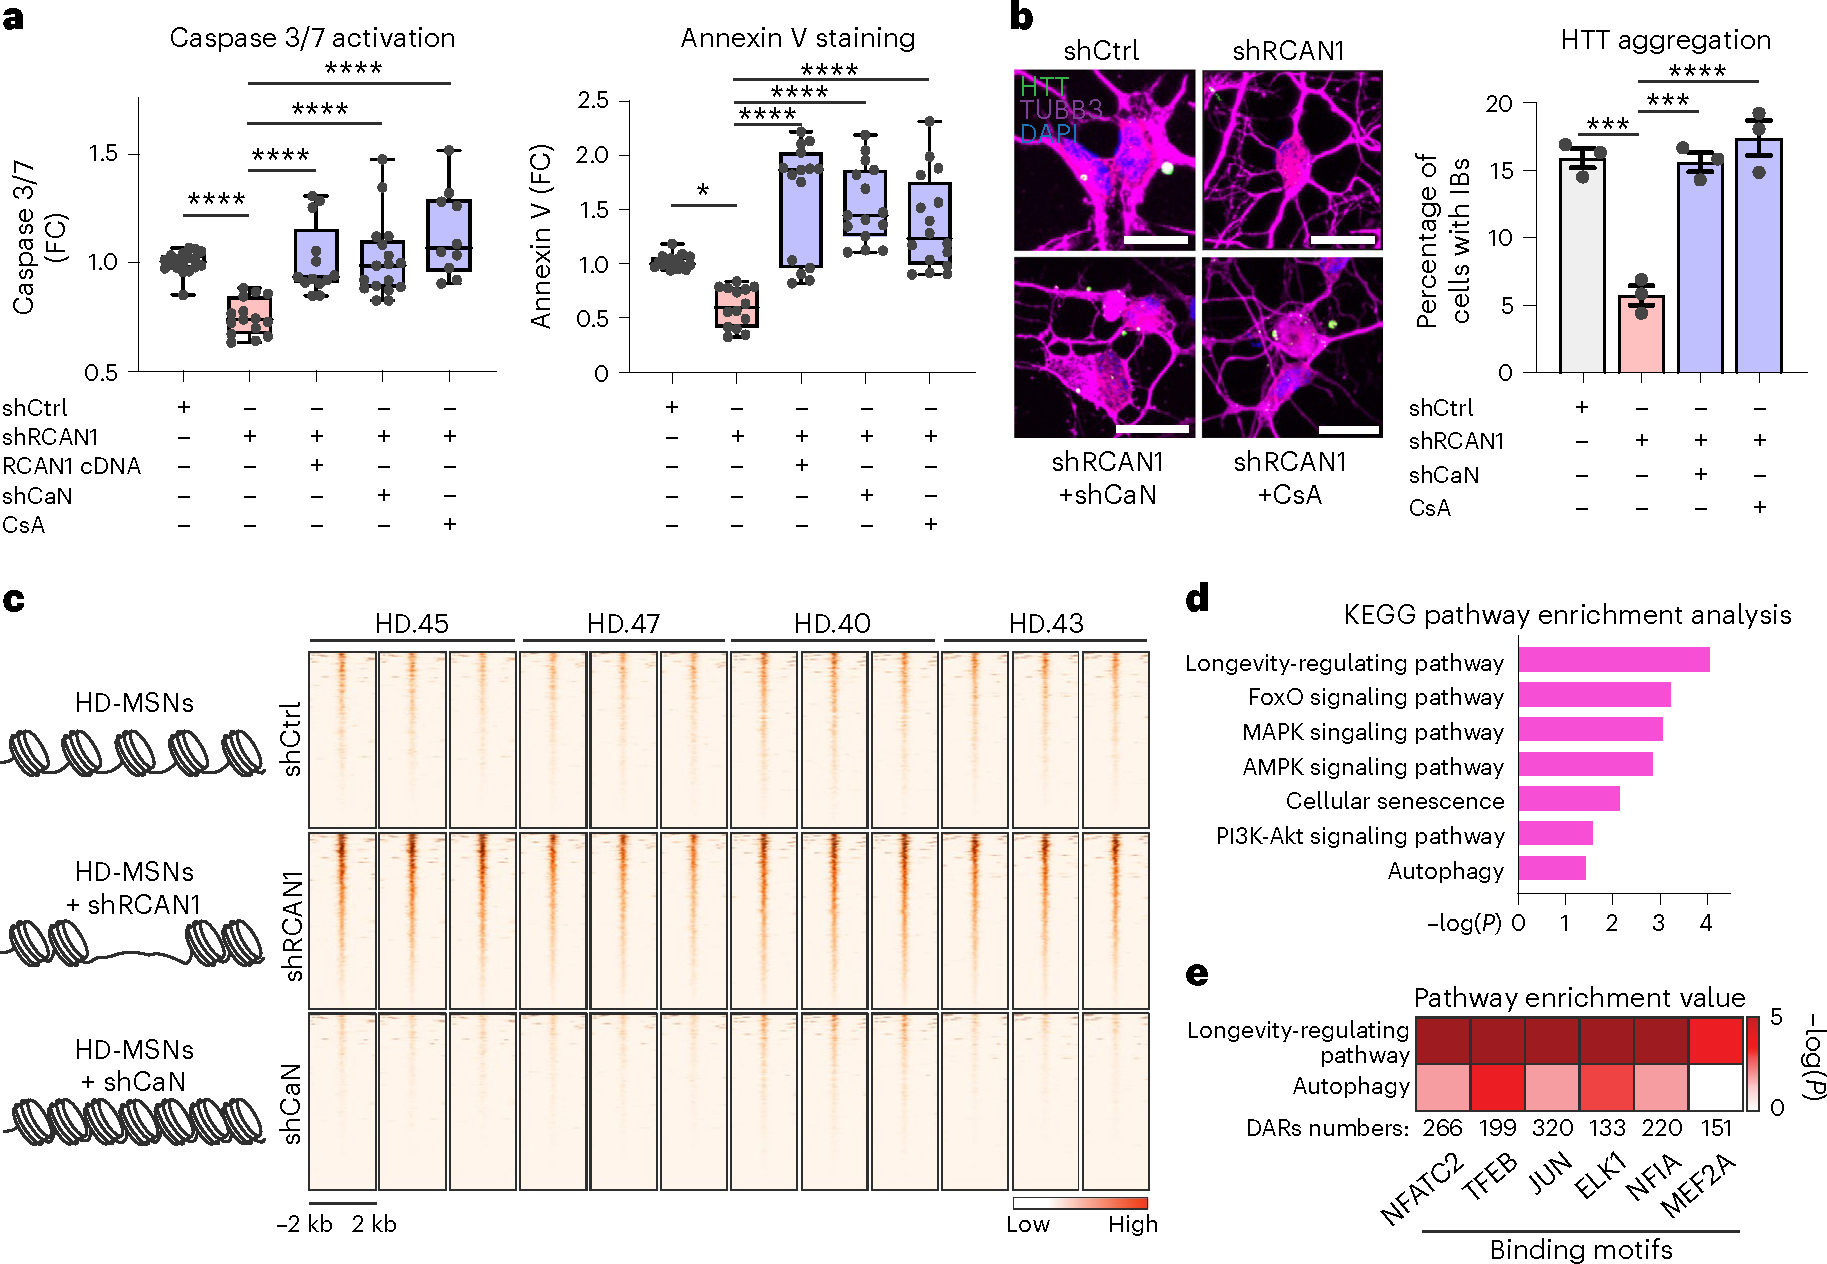
Fig. 3 |. RCAN1 KD- and CaN KD-induced chromatin changes.

a, Quantification of caspase 3/7 activation (left, n = 18, 15, 13, 17, 10) and annexin V signal (right, n = 18, 14, 15, 15, 16) in four independent HD-MSNs (HD43, HD40, HD47, HD45) transduced with shCtrl, shRCAN1, RCAN1 or shCaN. Cells were also treated with 10 μM CsA, a CaN inhibitor. In box-and-whisker plots, the center line denotes the median value, while the box contains the 25th to 75th percentiles of the dataset. The whiskers mark minimal value to maximal value. *P = 0.0175, ****P < 0.0001. b, Representative images (left) and quantification (right) of cells with HTT IBs in three independent HD-MSNs (HD.43, HD.40, HD.47; n = 3) transduced with shCtrl, shRCAN1 or shCaN. Cells were treated with 10 μM CsA. Cells were immunostained with anti-HTT and TUBB3 antibodies. An average of 117 cells each were counted from three or more randomly chosen fields. Scale bars, 20 μm. Mean ± s.e.m. shCtrl versus shRCAN1 ***P = 0.0002; shRCAN1 versus shRCAN1+shCaN ***P = 0.0003, ****P < 0.0001. c–e, Analysis of ATAC-seq from four independent HD-MSNs (HD43, HD40, HD47, HD45; three replicates each) transduced with shCtrl (control), shRCAN1 (rescuing) or shCaN (detrimental). c, Heatmaps of signal intensity in overlapping chromatin peaks of open DAR (FDR < 0.05, FC ≥ 1.5) in shRCAN1-HD-MSNs and closed DAR (FDR < 0.05, FC ≤ −1.5) in shCaN-HD-MSNs compared with shCtrl-HD-MSNs. d,e, KEGG pathway enrichment analysis (d) and pathway enrichment analysis (e) of genes associated with open DARs in shRCAN1-HD-MSNs and closed DARs in shCaN-HD-MSNs in c. Statistical significance was determined using one-way ANOVA with Tukey’s post hoc test in a and b; ****P < 0.0001, ***P < 0.001, *P < 0.05 (a,b). The sample size (n) corresponds to the number of biologically independent samples (a,b).
