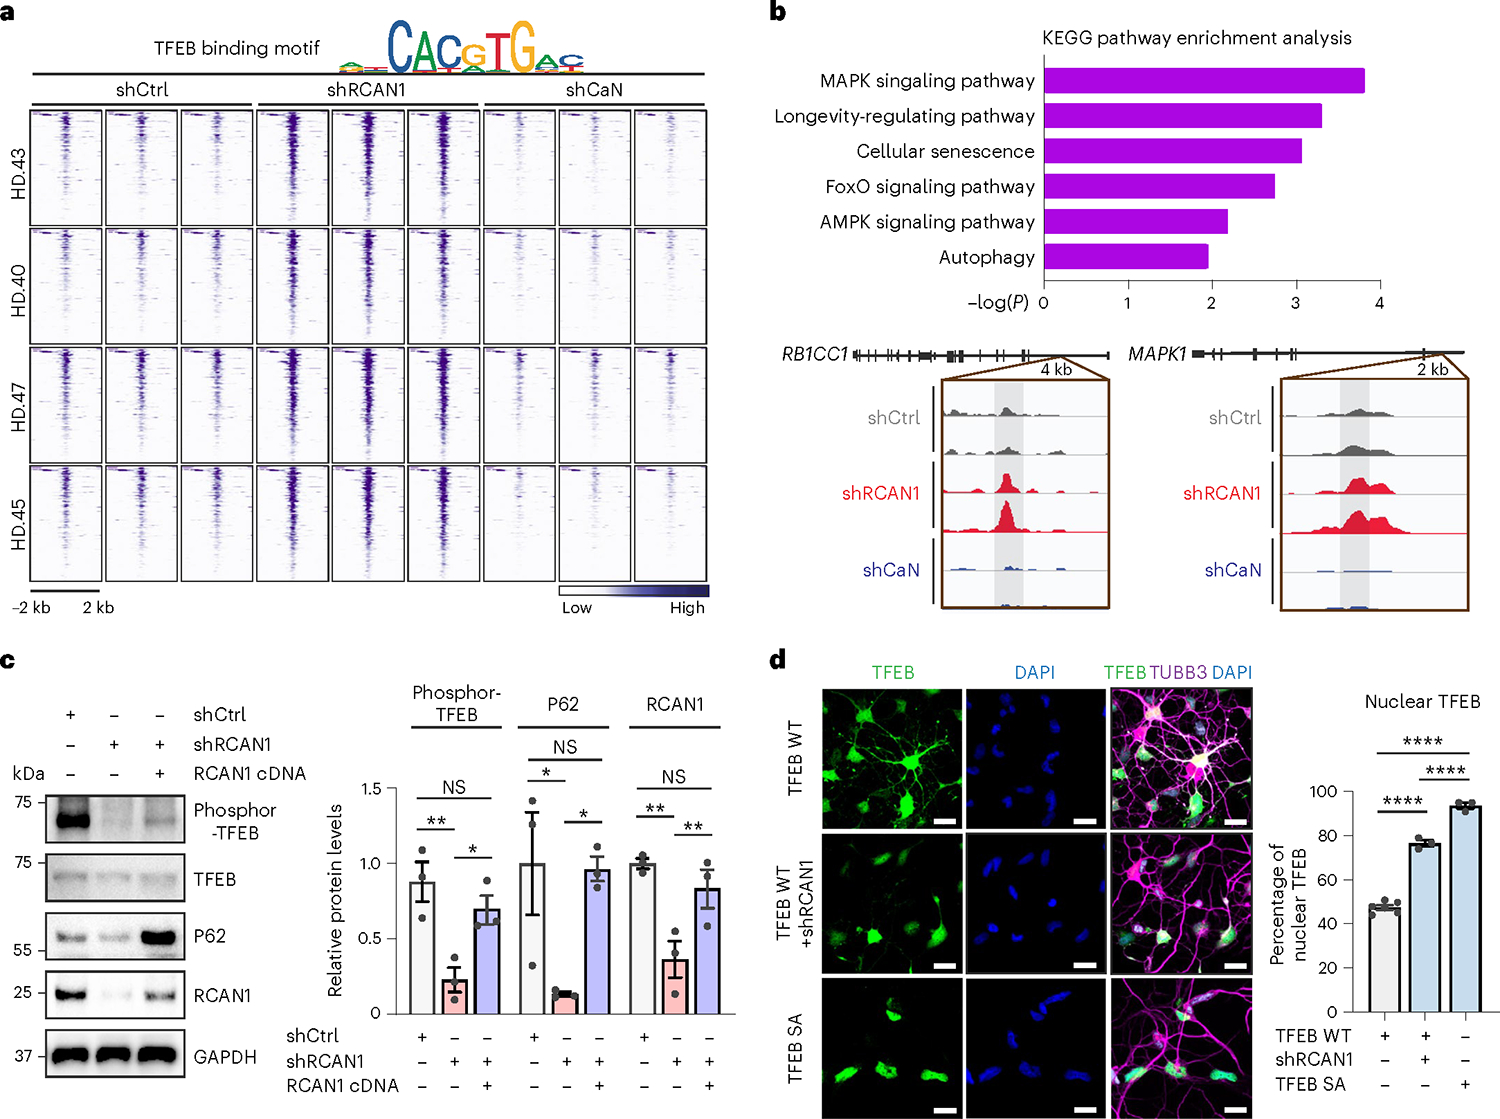
Fig. 4 |. Enhancing TFEB function by RCAN1 KD via its nuclear localization.

a, Heatmap representation of open DARs with shRCAN1 (rescuing) and closed DARs with shCaN (detrimental) harboring TFEB binding motifs, compared with shCtrl. Motif analysis from ATAC-seq was from four independent HD-MSNs (HD.43, HD.40, HD.47, HD.45; three biologically independent samples each) (FDR < 0.05, FC ≥ 1.5). Top legend depicts representative motifs for TFEB binding sites. b, KEGG pathway enrichment analysis (top) of TFEB binding motif-containing genes associated with DARs in a. Integrative Genomics Viewer snapshots (bottom) showing peaks enriched in shRCAN1-HD-MSNs (red) and reduced in shCaN-HD-MSNs (blue) within RB1CC1 and MAPK1 in comparison with shCtrl (gray). c, Representative immunoblotting (left) and quantification (right) of the expression of phosphor-TFEB (Ser142) from three independent HD-MSNs (HD.43, HD.40, HD.47; n = 3) transduced with shCtrl, shRCAN1 or RCAN1. Phosphor-TFEB (Ser142): **P = 0.0095, *P = 0.0495; P62: shCtrl versus shRCAN1 *P = 0.0497, shRCAN1 versus shRCAN1&RCAN1 cDNA *P = 0.0496; RCAN1: shCtrl versus shRCAN1 **P = 0.0023, shRCAN1 versus shRCAN1&RCAN1 cDNA **P = 0.0034. d, Representative image (left) and quantification (right) of nuclear TFEB from three independent HD-MSNs (HD.43, HD.40, HD.47) transduced with TFEB WT, shRCAN1 or TFEB phosphor-mutant (S142/211A (SA)). Cells were immunostained with anti-TFEB and TUBB3 antibodies. An average of 130 cells each were counted from three or more randomly chosen fields (n = 6, 3, 3). Scale bars, 20 μm. Statistical significance was determined using one-way ANOVA with Tukey’s post hoc test in c and d; ****P < 0.0001, **P < 0.01, *P < 0.05 and mean ± s.e.m. (c,d). The sample size (n) corresponds to the number of biologically independent samples (c,d).
