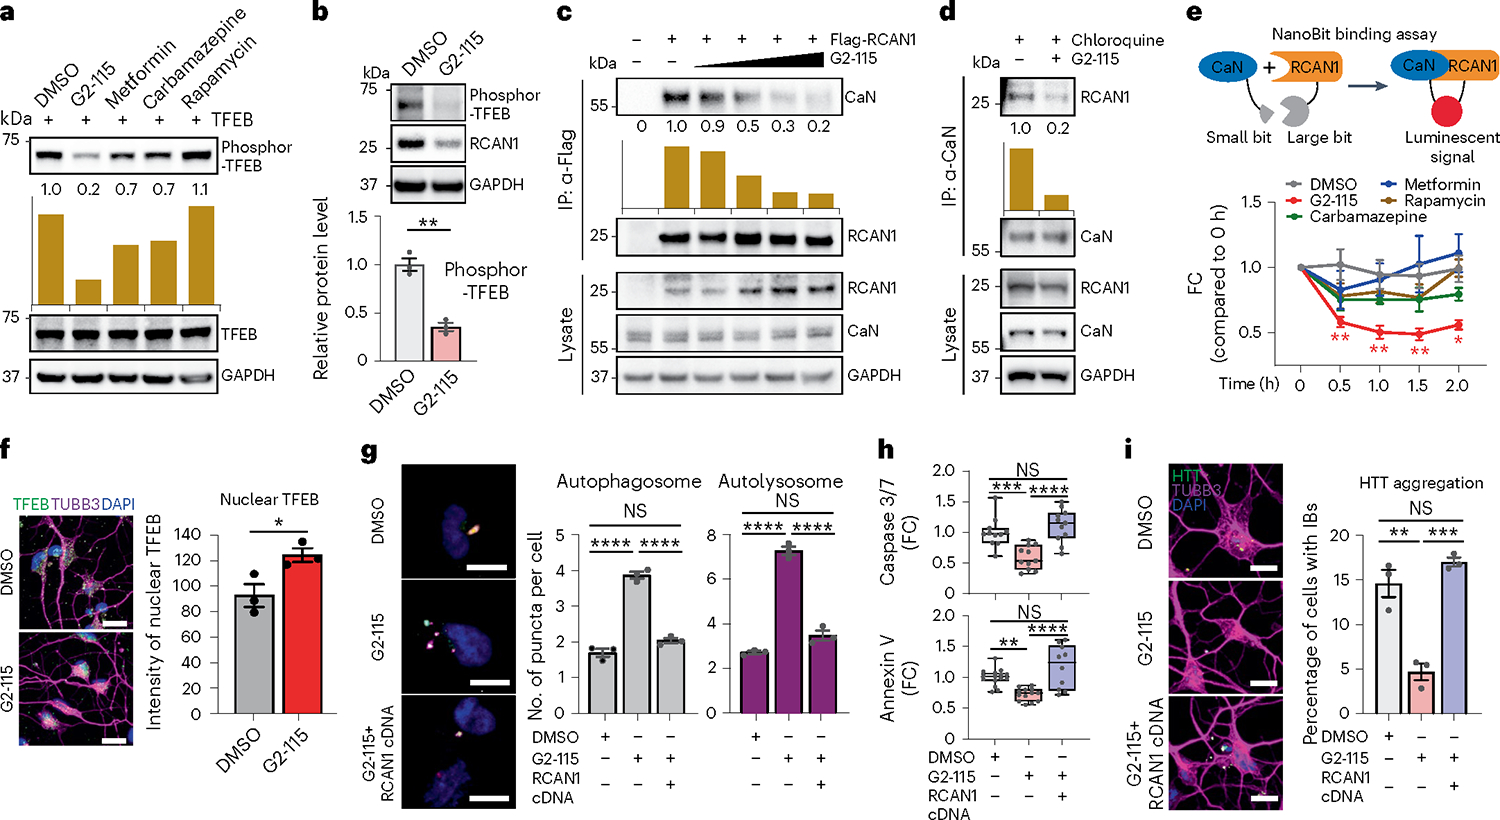
Fig. 6 |. G2–115 promotes TFEB function by reducing RCAN1–CaN interaction and promoting TFEB nuclear localization.

a,b, Immunoblotting of fibroblasts treated with DMSO, G2–115 (0.5 μM), metformin (8 mM), carbamazepine (100 μM) and rapamycin (500 nM) (a) and HD-MSNs (HD.47, HD.40, HD.45) treated with DMSO and G2–115 (0.5 μM) (n = 3, **P = 0.0013) (b) with anti-phosphor-TFEB (Ser142). c, Immunoprecipitation of Flag-RCAN1-transfected HEK293 cells with anti-Flag followed by CaN immunoblotting after G2–115 (0.25; 0.5; 2.5; 5 μM) treatment. d, Immunoprecipitation of chloroquine (lysosome inhibitor)-treated fibroblasts with anti-CaN followed by RCAN1 immunoblotting after DMSO, G2–115 (0.5 μM) and chloroquine (60 μM) treatment. e, Experimental scheme of NanoBit binding assay (top). Binding assay of HEK293 cells transfected with RCAN1-large-Bit and CaN-small-Bit (bottom) after G2–115 (2.0 μM), metformin (8 mM), carbamazepine (100 μM) and rapamycin (500 nM) treatment (n = 3 independent experiments). DMSO versus G2–115: 0.5 h **P = 0.0041; 1.0 h **P = 0.0037; 1.5 h **P = 0.0016; 2.0 h *P = 0.0111. f, Representative image (left) and quantification (right) of nuclear TFEB in HD-MSNs (HD.43, HD.45, HD.40) treated with DMSO and G2–115 (0.5 μM) (n = 3, *P = 0.0380). Scale bars, 20 μm. g, Representative images (left) of control and RCAN1-transduced HD-MSNs expressing the tandem monomeric mCherry-GFP-LC3 reporter. Quantification (right) of autophagosomes and autolysosomes from HD-MSNs with puncta (HD.40, HD.47, HD.43; n = 3; ****P < 0.0001; more than 50 cells per line) treated with DMSO and G2–115 (0.5 μM). Scale bars, 20 μm. h, Quantification of caspase 3/7 activation (top) from HD-MSNs (HD.40, HD.47, HD.45; n = 11) and annexin V signal (bottom) from HD-MSNs (HD.43, HD.47, HD.45; n = 15, 13, 10) treated with DMSO and G2–115 (0.5 μM) after control and RCAN1 transduction. In box-and-whisker plots, the center line denotes the median value, while the box contains the 25th to 75th percentiles of the dataset. The whiskers mark minimal value to maximal value. ****P < 0.0001, ***P = 0.0009, **P = 0.0028. i, Representative image (left) and quantification (right) of HTT IBs in control and RCAN1-transduced HD-MSNs (HD.43, HD.40, HD.47) treated with DMSO and G2–115 (0.5 μM) (n = 3; **P = 0.0015, ***P = 0.0005) followed by HTT and TUBB3 staining. An average of 300 cells were counted from three or more randomly chosen fields. Scale bars, 10 μm. Statistical significance was determined using one-way ANOVA with Tukey’s post hoc test (g,h,i) and two-tailed unpaired t-test (b,e,f); ****P < 0.0001, ***P < 0.001, **P < 0.01, *P < 0.05, NS, not significant, and mean ± s.e.m. (b,e,f,g,i). Sample size (n): number of biologically independent samples (b,f,g,h,i). IP, immunoprecipitation.
