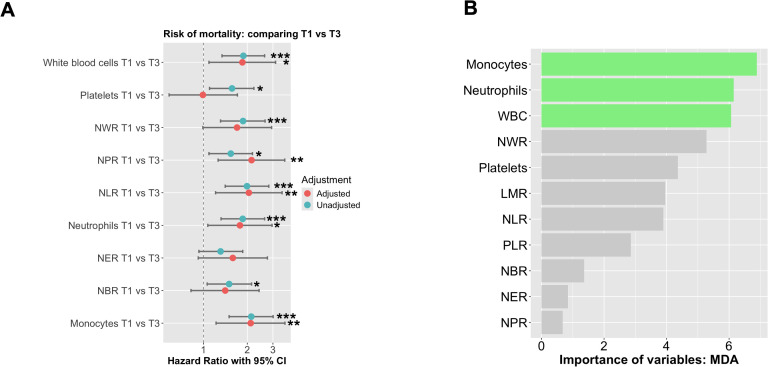
Figure 2.
The probability of mortality according to absolute neutrophil counts was analyzed using Cox proportional hazards regression. (A) The analysis was performed using Cox regression curves with tertiles of absolute neutrophil counts at baseline, both unadjusted and adjusted for BMI, sex, age, chemo- and radiotherapy, cancer stage (I+II vs III+IV), tumor site (colon vs rectum) + Histological grade (low vs high grade). T1 represents low neutrophil levels, T2 represents intermediate levels, and T3 represents high neutrophil levels. (B) Random forest of all significant variables included in our study to predict mortality. The symbols *, **, and *** indicate statistical significance, where * represents p < 0.05, ** represents p < 0.01, and *** represents p < 0.001.

