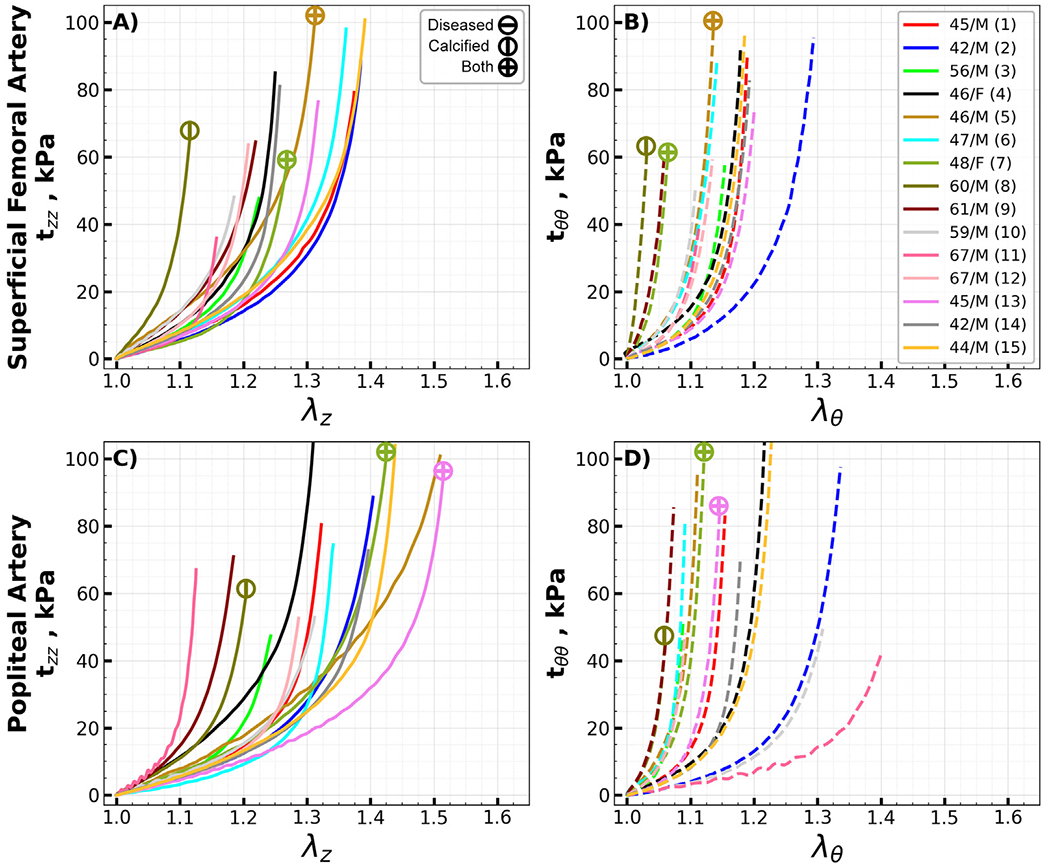
Fig. 10.

Equibiaxial Cauchy stress-stretch curves for all evaluated superficial femoral (SFA, A, B) and popliteal (PA, C, D) arteries in the longitudinal (z) and circumferential (θ) directions. Different colors represent different subjects. Arteries with atherosclerotic disease (disease stage greater than III) and calcified arteries (calcium volume greater than zero) are marked with circles containing horizontal and vertical lines, while circles with a cross represent arteries with both atherosclerosis and calcification. The age and sex of each subject are provided in the legend. (For interpretation of the references to color in this figure legend, the reader is referred to the web version of this article.)
