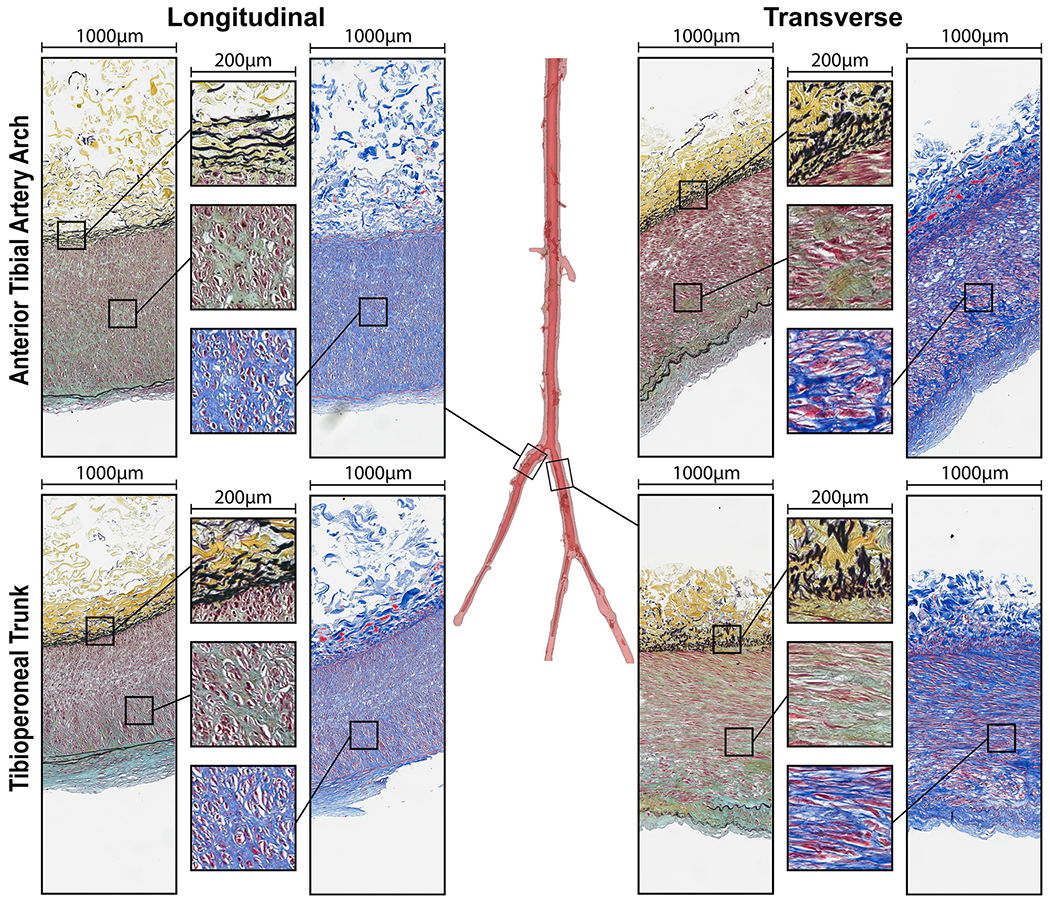
Fig. 7.

Structure of the transition zones: anterior tibial artery arch and the tibioperoneal trunk in longitudinal (left) and transverse (right) directions evaluated using Movat (elastin is black, glycosaminoglycans are greenish-gray) and Masson’s Trichrome (collagen is blue, smooth muscle is red) stains. Note directional differences in elastin (longitudinal fibers) and medial SMCs (mostly circumferential) demonstrated by the inserts. Compare the structure of these transition zones to the arteries above (Fig. 5) and below (Fig. 6) the knee from the same subject.
