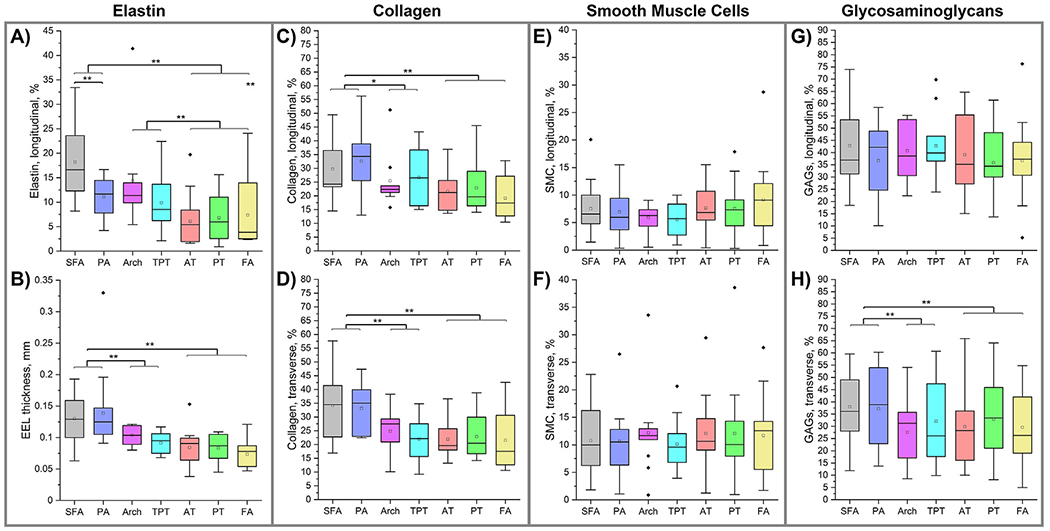
Fig. 8.

Structural composition of the above and below-knee arteries demonstrating the density of elastin in the EEL (A), thickness of the EEL (B), collagen content (C,D), smooth muscle cell (E,F), and glycosaminoglycan (G, H) content in the tunica media measured using longitudinal (top row) and circumferential (bottom row) sections. Statistically significant differences between groups at p < 0.05 are marked with a single asterisk and at p < 0.01 with a double asterisk. The boxes bound 25th and 75th percentiles, mean values are marked with a hollow square, median is represented by a horizontal line within each box, and outliers are marked with a solid black rhombus. Whiskers extend to the outmost data point that falls within upper inner and lower inner fence defined by 75th percentile + 1.5x interquartile range and 25th percentile − 1.5x interquartile range, respectively.
