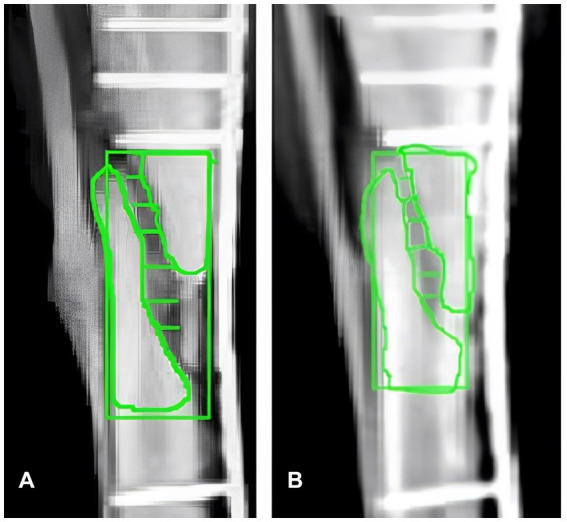
Figure 3.

Comparative X-ray analysis and ROI quantification using ImageJ. (A) X-ray image of the canine tibial fracture four weeks post-surgery, before treatment with PRP and Hap. (B) X-ray image ten days post-treatment with PRP and Hap. Six green segments (S1–S6) indicate significant positions along the fracture used for measuring the fracture gap. Two regions of interest (ROIs) above and below the fracture, along with a rectangular area encompassing the fracture site are highlighted for intensity analysis. The quantitative data derived from these ROIs, are presented in Table 1.
