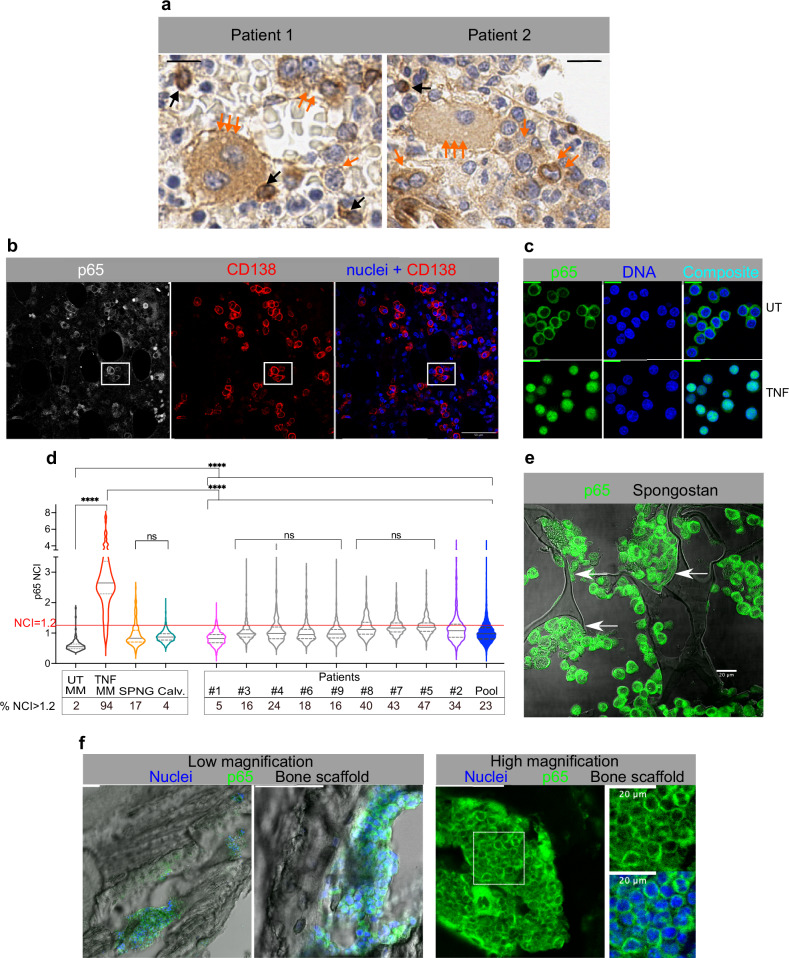
Fig. 1. NF-κB activation in BM-dwelling MM cells is mild and heterogeneous.
a NF-κB localizes in the cytoplasm of MM cells in patients’ BMs. Formalin Fixed Paraffin Embedded (FFPE) BM sections (Patient 1 and Patient 2) stained for p65 (DAB, brown signal) and counterstained with Haematoxylin (Blue). Orange arrows: a “set of three arrows” points to very large polynucleated cells. A “set of two” points to MM cells with dark brown cytoplasmic staining. Single arrows point to medium size MM cells with cytoplasmic staining and empty nuclei. Black arrows point to the few cells with heavy nuclear staining. Scale bar: 40 µm. b NF-κB localizes in the cytoplasm of CD138+ MM cells in myeloma patients’ BMs by IF. Confocal images of FFPE BM sections from myeloma patients stained for p65 (grey) and CD138 (red). Nuclei are counterstained with Hoechst 33342 (blue). The last panel is the composite image obtained by merging CD138 and nuclear fluorescent signals. Scale bar: 100 µm. Enlargements of the white square area in Supplementary Fig. 1d. c p65 localization by IF in human MM.1S cells. Cells untreated (UT) or treated with TNF-α for 60 min are stained for p65 (green) and nuclear DNA (blue). The last panel is the composite image. Scale bar: 20 µm. d Human MM cells in BMs show low levels of nuclear p65. Violin plots compare p65 NCI value distributions in CD138+ MM cells in the BM of nine MM patients (Pt.1-9 plus the pool of all the patients, full blue) with those from MM.1S cells either in static cultures (UT: unstimulated, TNF-α treated for 60’, pool of three experiments), or grown in coculture with HS-5 on Spongostan (SPNG, pool of two experiments), or engrafted in mouse calvaria (calvaria, pool of four mice). Median value: solid line, 25 and 75%: dashed lines. Numbers reported below the x-axis show the fraction (%) of cells displaying a p65 NCI > 1.2. Statistical analyses by ANOVA with Bonferroni multiple comparison test: significance as indicated in the plot: ****p < 0.0001, ns: not significant. e NF-κB is mainly cytoplasmic in MM.1S cells grown on SPNG scaffold in a RCCS Bioreactor. Composite confocal images for p65 (green) and bright field image (grey) on FFPE SPNG sections. Arrows point to stromal HS-5 cells (scale bar: 20 µm). Images are from one representative experiment out of three performed. f NF-κB is mainly cytoplasmic in MM.1S cells engrafting the mouse calvaria bones. Confocal images of MM.1S cells engrafted in mouse calvaria bones and IF stained for p65. Representative staining from 2 calvaria out of 7 analysed. Nuclei in blue, p65 in green, bone structures in grey, shown as composite images. Left: Large- and medium scale images of MM.1S cell clumps adhering to surface in calvaria cavities, scale bar 100 µm. Right: p65 staining image from a different calvaria section. The region identified by the white square is enlarged on the right and green and green plus blue images shown; scale bar: 100 µm, or 20 µm as indicated. Sample numerosity, median values and samples size above the NCI threshold are reported in Supplementary Table 3.

