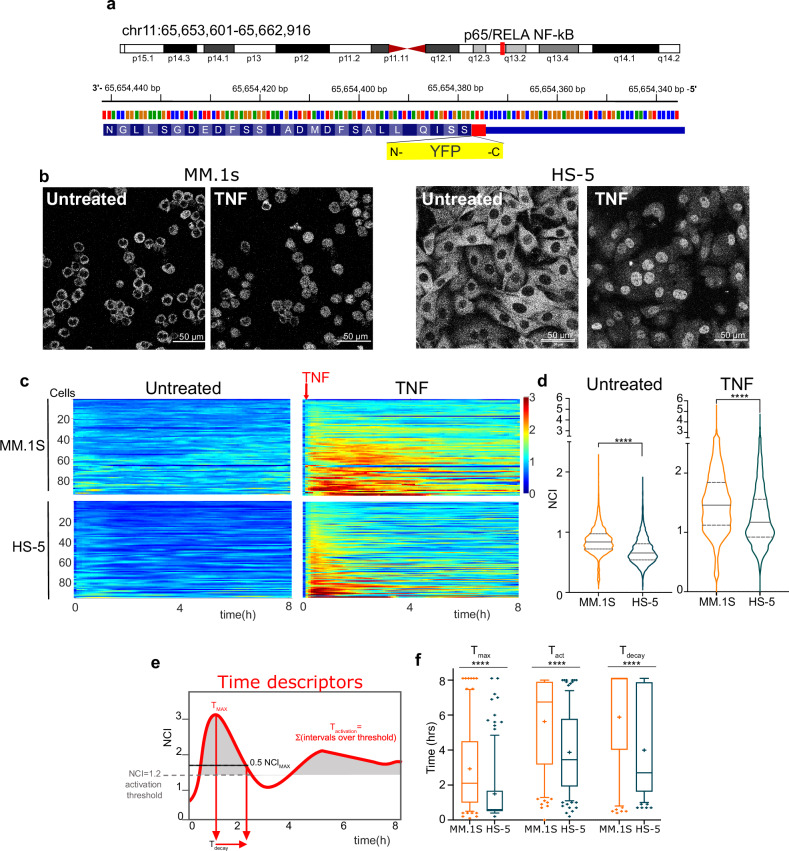
Fig. 2. Heterogenous NF-κB dynamics in living MM cells are suggestive of autocrine/paracrine NF-kB modulation.
a YFP knock-in cloning strategy. The Open Reading Frame of the Venus protein (YFP, yellow box) has been inserted upstream of the stop codon 552 (red) in exon 11. Genomic coordinates in the Methods section. b Live imaging of p65-YFP MM1.S cells and stromal HS-5. Confocal live cell images of unstimulated and 60’-TNF-α treated MM.1S (left) and HS-5 (right) cells after sorting. Scale bar: 50 µm. c Heterogenous NF-κB dynamics in living MM.1S cells and HS-5. Colorplots show NF-κB dynamics represented as NCI calculated every 6 min for 8 h in both untreated and TNF-α treated MM.1S cells and HS-5 cells, as indicated. Each line represents NCI values in a single cell as a function of time. The red arrow indicates the timepoint for TNF-α addition. y-axis: number of cells; x-axis: time in hours. Colorbar: NCI values from 0 (blue, cytoplasmic p65) to 3 (red, mainly nuclear p65). d Quantification of NF-κB dynamics in living MM.1S and HS-5 cells. Violin plots of NCI value distributions from the experiment in (c), representative of three performed. Median value: solid line, 25 and 75%: dashed lines. Significance between NCI distributions assessed by unpaired, two-tailed non-parametric t-test (Mann-Whitney, ****P < 0.0001,. N° of cells and Median values are reported in Supplementary Table 3. e Time parameters are needed to describe complex time-dependent dynamics. Time parameters are reported on an NCI plot from a single representative MM cell (red curve) stimulated for 8 h with TNF-α. Tmax and Tact are indicated by red arrows. The dotted black line indicates 0.5-fold NCImax to calculate Tdec. f Time responses of p65 in MM cells are prolonged as compared in HS-5. Boxplots for Tmax, Tact and Tdec values upon TNF-α stimulation, reported for the experiment shown in Fig. 1c. Median value as a solid line, the “+” indicates the mean value. Statistical analyses: ANOVA+ Bonferroni test.

