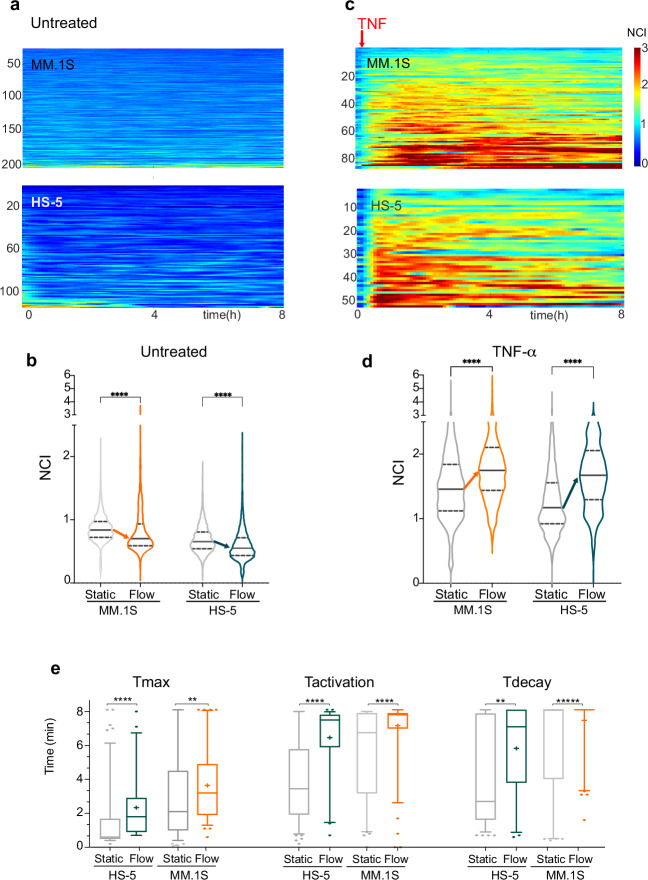
Fig. 3. Autocrine/paracrine signalling modulates NF-κB dynamics in both HS-5 stromal and myeloma MM.1S cells.
a Culture medium flow decreases NF-κB basal activity in both MM.1S cells and HS-5. Colorplots show basal NF-κB dynamics (NCI) for untreated myeloma cells and stromal cells for 8 h as indicated. Plots from a single experiment are representative of the four performed. y-axis: number of cells; x-axis: time in hours. NCI values colorbar from 0 (blue, cytoplasmic) to 3 (red, nuclear). b Quantification of basal NF-κB dynamics in cells exposed to medium flow. Violin plots show NCI values distributions in untreated MM.1S and HS-5 cells in static (grey) versus flow culture conditions (in colour) for 8 h in the experiment shown in “a”. Arrows indicate the decrease of the median value. Median value: solid line, 25 and 75%: dashed lines. Significance between NCI distributions was assessed by unpaired, two tailed non-parametric t-test (Mann-Whitney, P < 0.001, *** P < 0.0001, ****). N° of cells and Median values are reported in Supplementary Table 3. c Medium flow amplifies NF-κB responses to TNF-α in both MM.1S and HS-5 cells. Colorplots show NF-κB dynamics (NCI) for 8 h TNF-α treated MM.1S and HS-5 cells. y-axis: number of cells; x-axis: time in hours. Representative experiment of the four experiments performed. NCI values colorbar from 0 (blue, cytoplasmic) to 3 (red, nuclear). The red arrow indicates the timepoint for TNF-α addition. d Quantification of NF-κB dynamics in cells exposed to medium flow delivering TNF-α. Violin plots show NCI values distributions for TNF-α treated MM.1S and HS-5 cells in static (grey) versus flow culture conditions (colour) for 8 hours for the experiment represented in c. Arrows indicate the increase in median values. Median value: solid line, 25 and 75%: dashed lines. Significance between NCI distributions was assessed by unpaired, two tailed non-parametric t-test (Mann-Whitney, P < 0.001: ***, P < 0.0001: ****). N° of cells and Median values are reported in Supplementary Table 3. e The increase of Tact and Tdec defines the overall NF-κB activation increase upon TNF-α flow. Boxplots compare distributions for time descriptors in NF-κB dynamics in static and flow cultures for untreated or TNF-α treated cells as indicated. Median value drawn as a line, “+” indicates the mean value. Significance for T distribution differences was assessed by unpaired, two tailed non-parametric t-test (Mann-Whitney, P < 0.0001, **** P < 0.001, ***).

