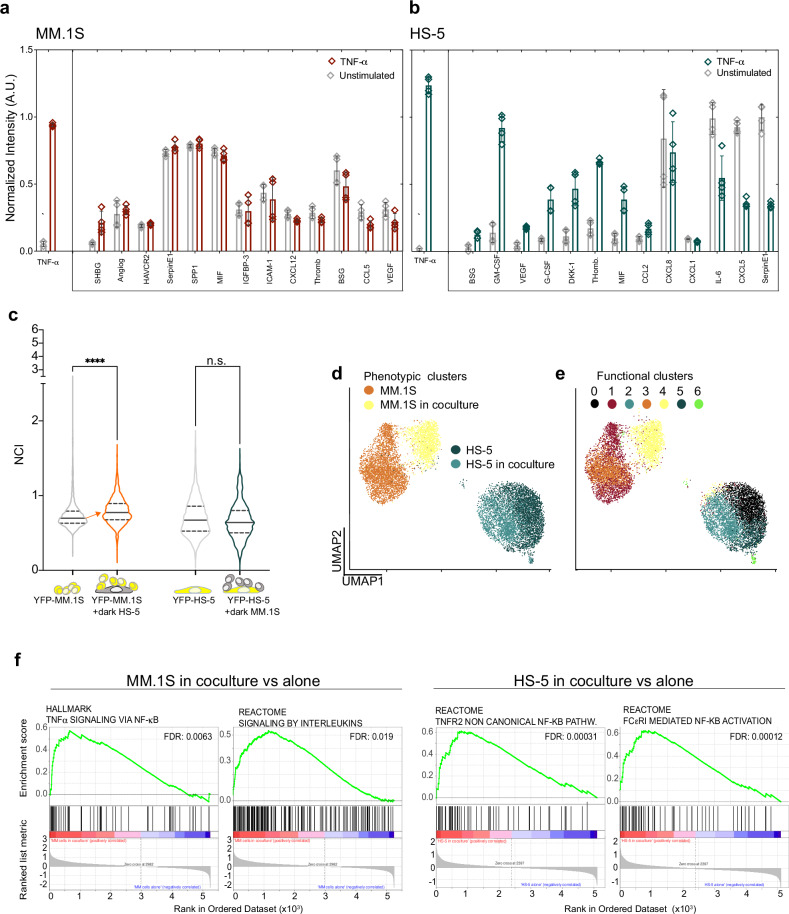
Fig. 4. Cell-to-cell crosstalk is due to released chemokines and cytokines (CKs).
a TNF-α driven secretory profiles in MM.1S cells. Histogram represents CK quantification in supernatants from untreated (grey bars) or TNF-α stimulated MM.1S cells (dark red) for two hours averaged from two independent experiments with technical duplicates. Error bars: SD. The quantification of the total TNF-α before and after TNF-α stimulation is plotted in a separated box on the left. y-axis: normalised fluorescence intensity in Arbitrary Units (AU). x-axis: detected CKs. b TNF-α driven secretory profiles in HS-5 cells. Histogram represents CK quantification in supernatants from untreated (grey bars) or TNF-α stimulated HS-5 cells (dark green) for two hours averaged from two independent experiments with technical duplicates. The quantification of the total TNF-α before and after TNF-α stimulation is plotted in a separated box on the left. The same experiment treating HS-5 with IL-1β is shown in Supplementary Fig. 11e. y-axis: normalised fluorescence intensity in AU. x-axis: detected CKs. Error bars: SD. c Paracrine signalling activates NF-κB dynamics only in MM.1S cells upon cocultures with HS-5 cells. Left: violin plots compare NF-κB NCI distributions in p65-YFP MM.1S cells alone (grey) or in coculture with wildtype HS-5 (red). Right: NF-κB NCI distributions in p65-YFP HS-5 alone (grey) or cocultured with wildtype MM.1S cells (green). The schematic on the bottom summarises the cultures: yellow cells express p65-YFP and the grey ones (dark) are wildtype. The orange arrow indicates the median NCI increase. y-axis: NCI. This experiment is representative of two performed. Significance between NCI distributions were assessed by ANOVA/Kruskal-Wallis test with Dunn’s correction for multiple comparisons (P < 0.0001 and ns). N° of cells and Median values are reported in Supplementary Table 3. d The transcription profile of MM.1S cells changes upon coculture with HS-5 cells. Single cell RNA-seq was performed on MM.1S and HS-5 cells, grown in monoculture or in coculture for 2 h. Dot-plot: UMAP clustering on cell type IDs identifies four populations represented as four coloured clusters (each dot is a single cell). MM.1S in monoculture, orange, in coculture, yellow; HS-5 in monoculture, dark green, in coculture, light green. x- and y- axes: UMAP1 and 2, respectively. e A small fraction of cells upregulates NF-κB-driven gene transcription. UMAP functional clustering based on the most abundant transcripts identifies seven transcriptionally homogeneous clusters (from 0 to 6, color-coded as indicated). The genes characterizing each cluster are reported in Supplementary Table 2 (cluster_markers). f NF-κB driven transcription is activated in both MM.1S and HS-5 cells upon coculture. GSEA analyses identify in MM.1S and HS-5 cells (left and right, respectively) some of the NF-κB driven pathways that are upregulated by coculture. False Discovery rate (FDR) is reported in each diagram.

