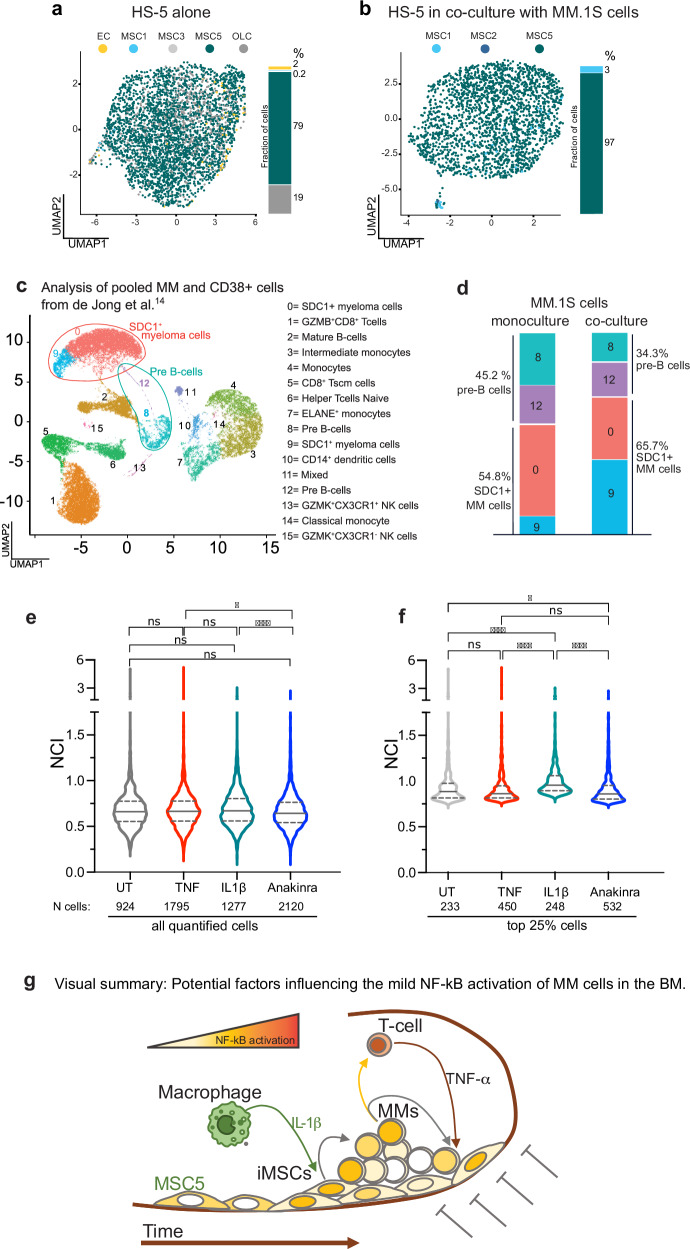
Fig. 6. Soluble crosstalk in the BM niche modulates the transcriptional profiles in both myeloma and stromal cells.
a HS-5 have a transcriptional phenotype similar to non-inflammatory mesenchymal stromal cells. UMAP data representation from our scRNA seq assigns identities to HS-5 in monoculture using the nomenclature reported in de Jong et al. [14] and colour coded as indicated in the legend: MSC 1 and 2 (inflammatory, myeloma specific, iMSCs, MSC1: light blue. MSC2 not present), MSC3 and 5 (MSCs present in healthy subjects, light grey and teal). OLC: Osteolineage cells (dark grey): EC: Endothelial Cells (yellow). The histogram on the right side of the UMAP plot report the frequency of each subpopulation as percentage. b A fraction of HS-5 acquires an iMSCs transcriptional phenotype when in coculture with MM.1S cells. Similar to panel a, UMAP representation assigns identities to single HS-5 cells upon coculture with MM.1S cells using the nomenclature reported in de Jong et al. for myeloma patients [14] and colour coded as indicated in the legend, MSC 1 and 2 (inflammatory, myeloma specific, iMSCs, light and dark blue), MSC5 (MSCs present in healthy subjects, teal). See also Supplementary Fig. 11 for population identification. The histogram on the right side of the UMAP plot reports the frequency of each subpopulation expressed as percentage. Cell numbers and frequency for each subpopulation are reported in Supplementary Table 3. c primary MM cells account for a large fraction of the immune CD38+ cells in the BM of myeloma patients. Extended data 6 from de Jong et al. [14] has been reanalysed by merging the subset of primary CD38+ immune cells with CD38 + /SDC1+ myeloma cells. All the cells are plotted in a single UMAP representation using the nomenclature reported in [14] and colour coded as indicated in the legend on the right. d The autocrine/paracrine signalling in MM.1S-HS-5 cocultures activates in MM.1S transcription profiles typical of myeloma cells. The transcriptional signature of MM.1S cells in monoculture (our sc-RNA seq in Fig. 4) identifies four types of cells which overlap with clusters 8 and 12 (pre-B cells) and clusters 0 and 9 (SDC1 + MM cells) identified in panel c. Similarly, the histogram on the right quantifies the changes in the subpopulation fractions in MM.1S cells before and after exposure to HS-5 for 2 hours. Population fractions are expressed as percentage (side of the histogram). Cell number and frequency for each subpopulation are reported in Supplementary Table 3. e IL-1β treatment recapitulates NF-κB activation in the mouse model. Violin plots compare NF-κB activation (NCI) in all the MM.1S cells quantified for p65 NCI in the calvaria of mice, which have been left untreated (UT, grey) or treated for 3 hours with TNF-α (red) or IL-1β (teal), or with Anakinra for 24 h (blue, IL1Ra IL-1β inhibitor). Number of cells analysed are reported below the x-axis. f IL-1β treatment increases NF-κB activation in a fraction of MM cells in the mouse model. The plot shows NCI value distribution for cells with high NCI (top 25%). Statistical analyses by ANOVA with Dunn multiple comparison test: significance as indicated in the plot: **** p < 0.0001, * p = 0.037, ns: not significant). g Visual summary: Potential factors influencing the mild NF-kB activation of MM cells in the BM. The schematic integrates our results for the reciprocal feedforward control on NF-κB activity in the BM niche of myeloma patients. In the inflammatory BM of myeloma patients, macrophages contribute to increase IL-1β levels which activates NF-κB-driven transcription in stromal cells (MSCs). Activated MSCs produce paracrine signals, which are captured by a small fraction of hypersensitive MM.1S cells. In turn, activated MM.1S cells both self-reinforce positive NF-κB feedback loops and send paracrine signals to neighbouring myeloma cells. Potentially, CKs secreted by MM.1S cells could stimulate T lymphocytes to deliver NF-κB-activating TNF-α to neighbouring MSCs and MM cells. The inflammatory ME might change the transcriptional phenotype of MSCs toward a more inflammatory one (iMSCs). In addition, being at the interface between myeloma cells and the bone, MSCs receive NF-κB dampening signals from the bone scaffold as happens in vitro, which counterbalance the inflammatory signals from the cellular niche. As a result, the in vivo ME is kept mildly inflammatory toward myeloma cells.

