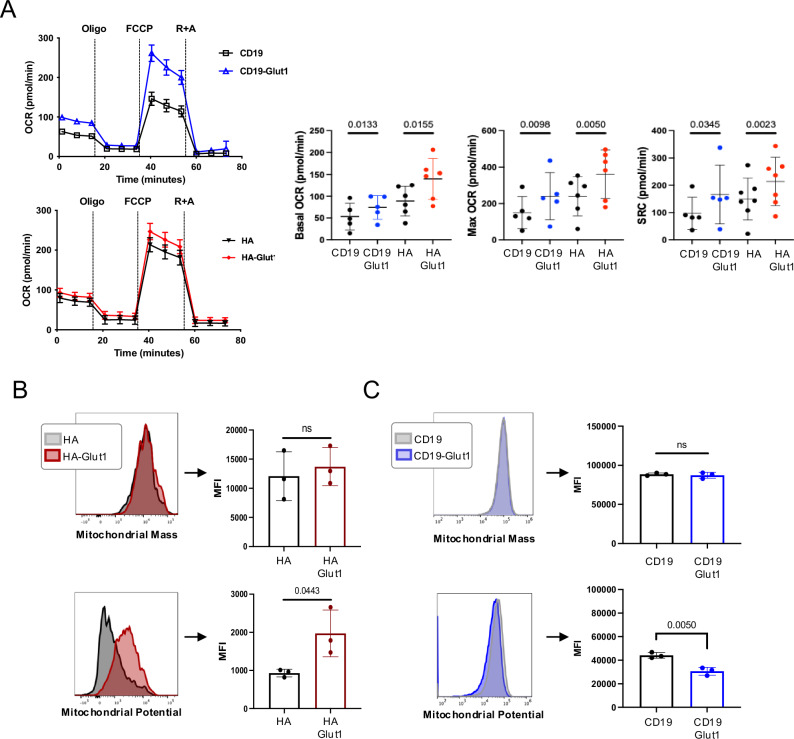
Fig. 2. GLUT1 overexpression enhances oxidative phosphorylation.
A (LEFT) Representative OCR (Oxygen Consumption Rate) data measured using Seahorse for CD19 ± GLUT1OE or for HA ± GLUT1OE on day 12. (RIGHT) Pool data for Basal and Maximum OCR and SRC (Spare Respiratory Capacity) from three independent experiments with n = 6 donors. P values determined by paired two-tailed t-tests. Error bars represent SD. B (TOP) Mitochondrial mass and (BOTTOM) potential detected using Mitotracker Green and Deep Red, respectively in HA ± GLUT1OE CAR-T cells on day 9 with representative histograms shown. Data from n = 3 donors. P values determined by paired two-tailed t-tests. Error bars represent SD. C (TOP) Mitochondrial mass and (BOTTOM) potential detected using Mitotracker Green and Deep Red, respectively in CD19 ± GLUT1OE CAR-T cells on day 9 with representative histograms shown. Data from n = 3 donors. P values determined by paired two-tailed t-tests. Error bars represent SD.

