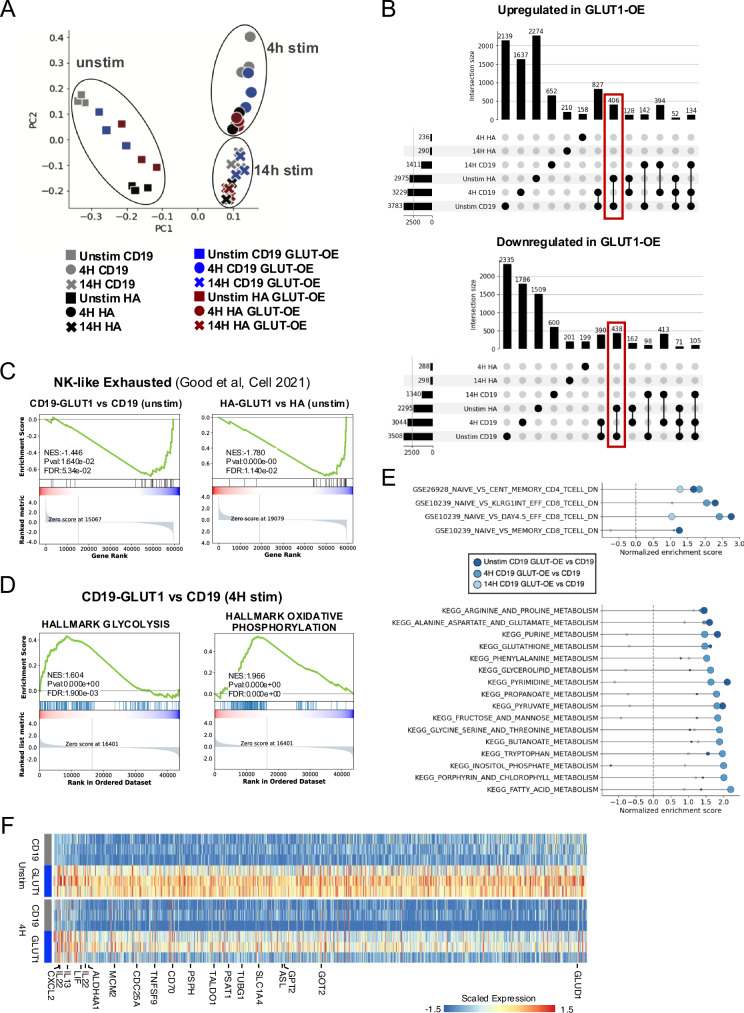
Fig. 3. GLUT1 overexpression induces transcriptional reprogramming.
A Unbiased principal component analysis of bulk RNA derived from day 16 CD19 and HA ± GLUT1OE ± 1 µg / mL anti-idiotype stimulation collected at two different time points. Cotransduced cells were magnetically enriched for greater than 95% double positive prior to experiment. Pooled data from two experiments (stimulated and unstimulated) with total n = 6 donors. B UpSets plots showing intersection of genes differentially upregulated (TOP) or downregulated (BOTTOM) upon GLUT1OE in HA-CAR and CD19-CAR T cells unstimulated or at 4 h and 14 h post stimulation. Red boxes highlight shared changes between CD19-CAR and HA-CAR T cells as a consequence of GLUT1OE at baseline. RNAseq data from n = 6 donors on day 16. C GSEA analysis of the NK-like exhaustion signature in unstimulated (LEFT) CD19 and (RIGHT) HA-CAR-T cells, comparing GLUT1OE versus control. D GSEA analysis of (LEFT) glycolysis and (RIGHT) OXPHOS for CD19 ± GLUT1OE after 4 h of anti-idiotype stimulation (1 µg/mL). E (TOP) GSEA analysis of RNA-seq comparing CD19 GLUT1OE vs CD19 showing enrichment of memory and effector T cell signatures over naïve in CD4 and CD8 at every timepoint analyzed (unstimulated, 4 h or 14 h post-stimulation). (BOTTOM) Similar GSEA analysis using as reference KEGG pathways dataset showing wide metabolic reprogramming. The size of the dots correlates with −log10(P-value) by GSEA analysis, with the smallest dots representing non-significant pathways. F Heatmap representing differentially expressed genes with annotations for those significantly upregulated in CD19-GLUT1 ± 4 h of anti-idiotype stimulation.

