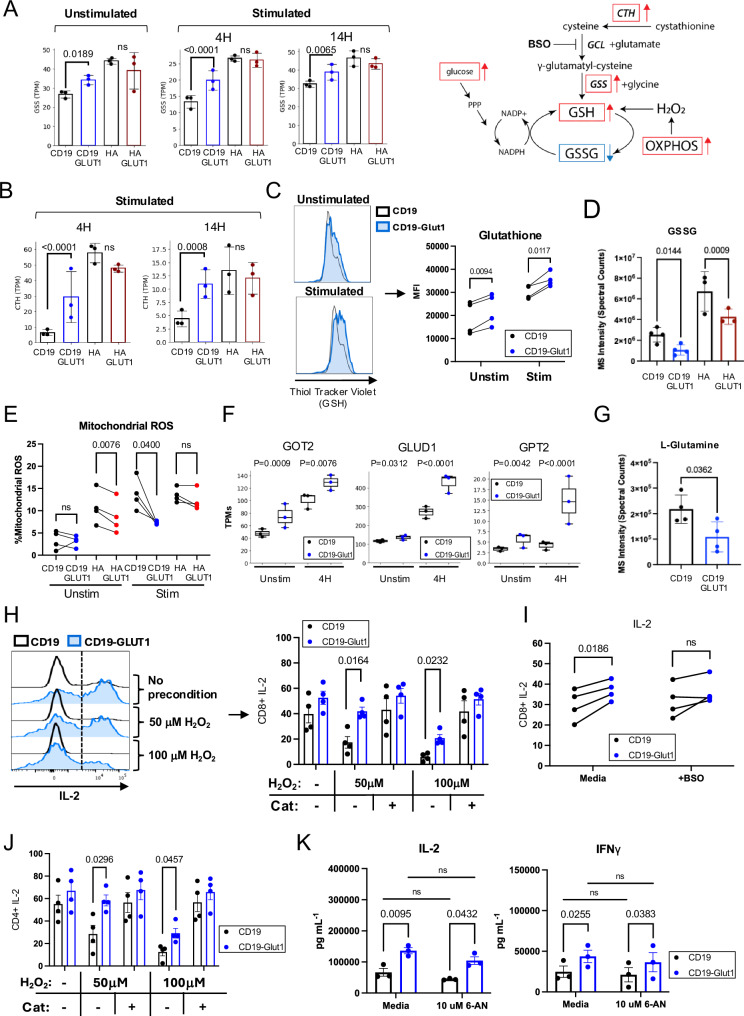
Fig. 5. GLUT1 overexpression enhances metabolic pathways that favor resistance to REDOX suppression.
A (LEFT) Transcripts Per Million (TPMs) of GSS (Glutathione Synthetase) transcripts for CD19 and HA ± GLUT1OE CAR-T cells at baseline and stimulated for 4 h and 14 h with anti-idiotype. Data from n = 3 donors. P values calculated using DESeq2. (RIGHT) Schematic of pathways involved in GSH REDOX with relevant metabolomic derivatives. Red arrows indicate elements found to be enriched with GLUT1OE. Blue arrows indicate elements found to be decreased with GLUT1OE. B TPMs of CTH (cystathionine gamma-lyase) transcripts for CD19 and HA ± GLUT1OE CAR-T cells stimulated for (LEFT) 4 h and (RIGHT) 14 h with anti-idiotype. Data from n = 3 donors. P values calculated using DESeq2. C (LEFT) Representative histograms showing CAR+ intracellular GSH content using ThiolTracker for CD19 ± GLUT1OE CAR-T cells ± 4 h 1 µg / mL anti-idiotype stimulation. (RIGHT) Quantitative data of CAR + GSH MFI. Cotransduced cells were magnetically enriched for greater than 95% double positive prior to experiment. Data from n = 4 donors. P values determined by paired t-tests. D Untargeted LC-MS data depicting cysteineglutathione disulfide (GSSG, or oxidized GSH) abundance in electronically sorted CD19 and HA ± GLUT1OE CAR-T cells at day 14. Pooled data of n = 4 donors. P values determined by unpaired two-tailed t-tests. Error bars represent SD. E Pooled mitochondrial ROS data collected via intracellular staining. Day 15 CAR-T cells were subject to 2 h anti-idiotype stimulation. Data were reflective of n = 4 donors. P values determined by paired t-tests. F A TPMs of glutaminolysis-related genes GOT2, GLUD1, and GPT2 transcripts for CD19 ± GLUT1OE CAR-T cells unstimulated or stimulated for 4 h with anti-idiotype. Data from n = 3 donors. P values calculated using DESeq2. G Untargeted LC-MS data depicting L-glutamine abundance in electronically sorted CD19 ± GLUT1OE CAR-T cells at day 14. Pooled data of n = 4 donors. P values determined by unpaired two-tailed t-tests. Error bars represent SD. H Intracellular IL-2 staining for CD8+ CD19 ± GLUT1OE CAR-T cells ± pre-exposure to oxidative stress (hydrogen peroxide). (LEFT) Representative flow cytometry. (RIGHT) Pooled data. Cells were challenged with Nalm6-GL at a 1:1 ratio on day 14. Data from n = 4 donors. P values determined by paired t-tests. Error bars represent SEM. I Intracellular IL-2 staining for CD8+ CD19 ± GLUT1OE CAR-T cells stimulated ± BSO (Buthionine Sulfoximine). Cells were stimulated via 1 ug/L plate-bound anti-idiotype on day 14. Data from n = 4 donors. P values determined by paired t-tests. Error bars represent SEM. J Intracellular IL-2 staining for CD4+ CD19 ± GLUT1OE CAR-T cells ± pre-exposure to oxidative stress (hydrogen peroxide). Cells were challenged with Nalm6-GL at a 1:1 ratio on day 14. Data from n = 4 donors. P values determined by paired t-tests. Error bars represent SEM. K Cytokine secretion of CD19 ± GLUT1OE CAR-T cells challenged 1:1 with Nalm6 leukemia ± 6-Aminonicotinamide (6-AN) on day 14 as measured by ELISA. Data reflective of n = 3 donors. P values determined by paired t-tests. Error bars represent SEM.

