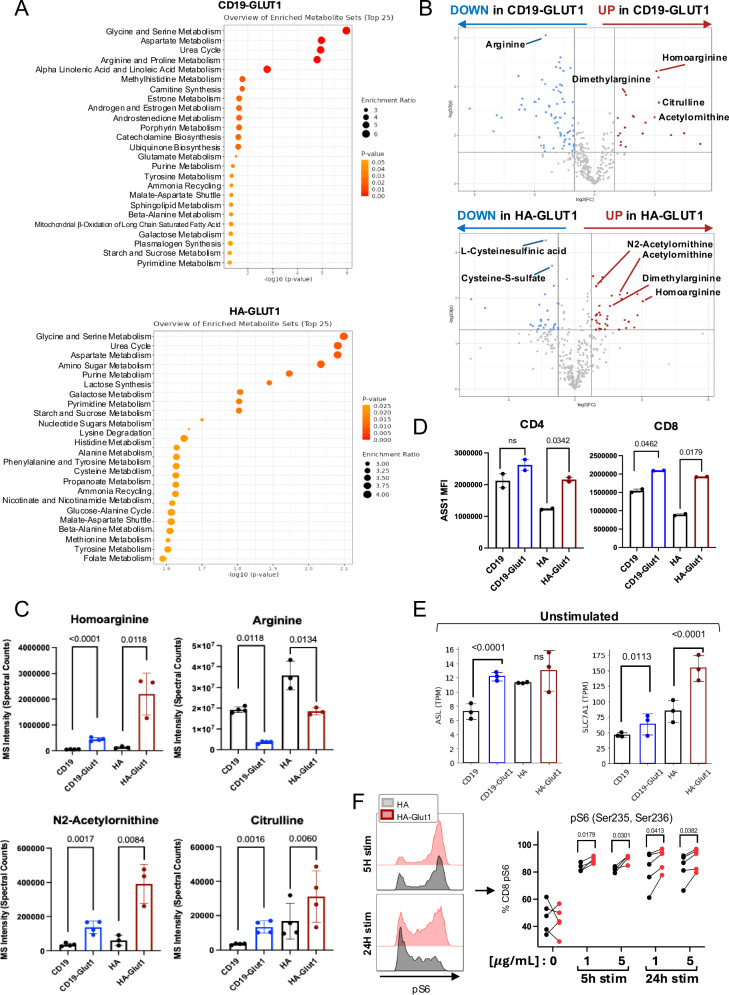
Fig. 6. GLUT1 overexpression alters arginine metabolism.
A LC-MS data depicting top metabolomic pathways enriched in electronically sorted (TOP) CD19-GLUT1 and (BOTTOM) HA-GLUT1 CAR-T cells on day 14. Significantly differential metabolites were analyzed using MetaboAnalyst. B Volcano plots of metabolite abundance related to the Urea Cycle in electronically sorted (TOP) CD19-GLUT1 and (BOTTOM) HA-GLUT1 CAR-T cells on day 14. Red circles indicate metabolites that significantly increased. Blue circles indicate metabolites that significantly decreased. Data from n = 4 donors. C Quantitative data showing metabolites involved in Urea Cycle for electronically sorted CD19 and HA ± GLUT1OE on day 14. Data from n = 3 or 4 donors. P values determined by unpaired two-tailed t-tests. Error bars represent SD. D Flow cytometric analysis of intracellular expression of Argininosuccinate synthase 1 (ASS1) on (LEFT) CD4 and (RIGHT) CD8 CD19 and HA ± GLUT1OE CAR-T cells on day 16. Quantitative data from n = 2 donors. P values determined by paired two-tailed t-tests. Error bars represent SD. E TPMs of (LEFT) ASL (argininosuccinate lyase) and (RIGHT) SLC7A1 transcripts for CD19 and HA ± GLUT1OE CAR-T cells at baseline. Data from n = 3 donors. P values determined by paired two-tailed t-tests. Error bars represent SD. F (LEFT) Representative histograms of intracellular phosphorylated ribosomal subunit 6 (pS6) 5 and 24 h after anti-idiotype stimulation for CD8 + HA ± GLUT1OE CAR-T cells on day 16. (RIGHT) Quantitative data of CD8+ pS6+ HA ± GLUT1OE CAR-T cells ± stimulation. Data from n = 4 or 5 donors. P values determined by paired two-tailed t-tests.

