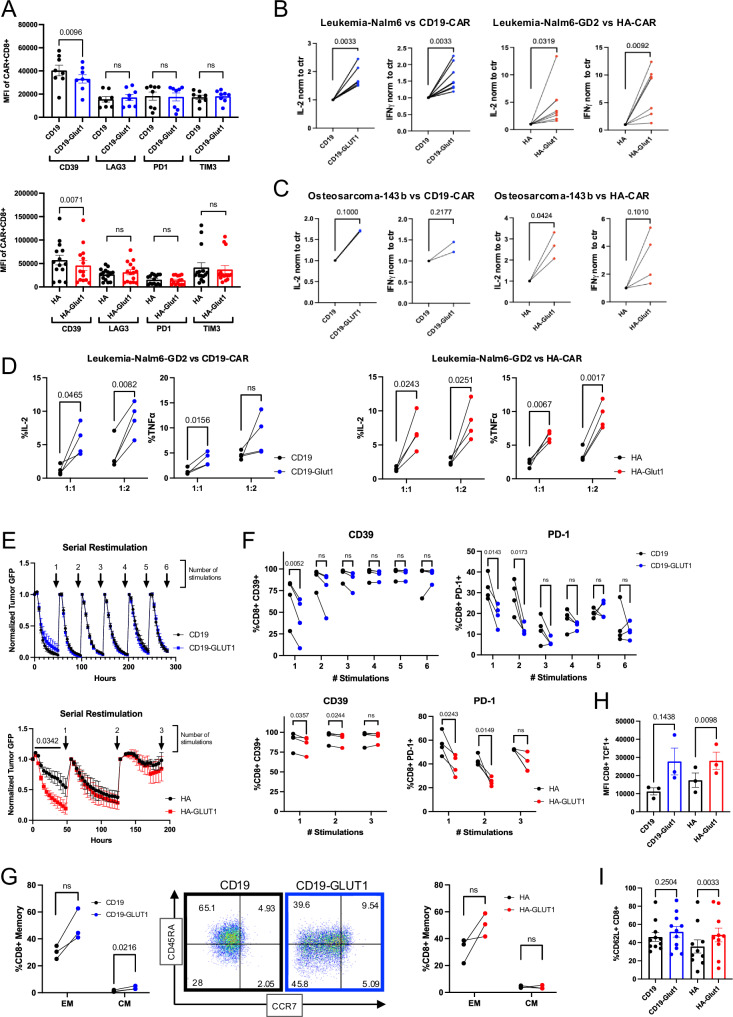
Fig. 8. GLUT1 overexpression enhances potency and delays onset of exhaustion in response to tumor rechallenge.
A MFI of exhaustion markers CD39, LAG3, PD1 and TIM3 expressed by (TOP) CD19 or (BOTTOM) HA ± CD8+ GLUT1OE CAR-T cells on day 14. Pooled data of n = 14 donors. P values determined by paired two-tailed t-tests. Error bars represent SEM. B ELISA analysis of IL-2 and IFNγ secretion by CD19 and HA ± GLUT1OE CAR-T cells after 24 hour stimulation with (LEFT) Nalm6 or (RIGHT) Nalm6-GD2 leukemia tumor lines on day 14. Data from n = 6 donors. P values determined by paired two-tailed t-tests. C ELISA analysis of IL-2 and IFNγ secreted by CAR-T cells ± GLUT1OE CAR-T cells after 24 hour stimulation with 143b against (LEFT) CD19 and (RIGHT) HA on day 14. Data from n = 2–4 donors. P values determined by paired two-tailed t-tests. D Intracellular staining of IL-2 and TNFα by (LEFT) CD19 and (RIGHT) HA ± GLUT1OE CAR-T cells after 24 h of stimulation with Nalm6-GD2 leukemia at 1:1 and 1:2 E:T on day 14. Data from n = 4 donors. P values determined by paired two-tailed t-tests. E Serial rechallenge and tumor-GFP killing kinetics data using Incucyte. Pooled data of 4 donors (TOP) CD19 and (BOTTOM) HA ± GLUT1OE CAR-T cells sequentially challenged at 1:2 ratio with Nalm6 leukemia ± GD2. Incucyte p values generated using two way ANOVA. Error bars represent SEM. F Flow cytometry measurements of CD39 and PD-1 of CD8+ (TOP) CD19 and (BOTTOM) HA ± GLUT1OE CAR-T cells after each stimulation denoted by arrows in (E). P values determined by paired two-tailed t-tests. G Memory formation data of serially rechallenged CD8+ CAR-T cells after (LEFT) 4 stimulations for CD19 ± GLUT1OE with representative flow cytometry of CD62L+ cells and (RIGHT) 3 stimulations for HA ± GLUT1OE. EM- effector memory, CM- central memory. P values determined by paired two-tailed t-tests. H Pooled intracellular expression of TCF1 in CD19 and HA ± GLUT1OE CAR-T cells on day 16. Data from n = 3–4 donors. P values determined by paired two-tailed t-tests. Error bars represent SEM. I Pooled surface expression of CD62L in CD19 or HA ± GLUT1OE CAR-T cells on day 16. P values determined by paired two-tailed t-tests. Error bars represent SEM.

