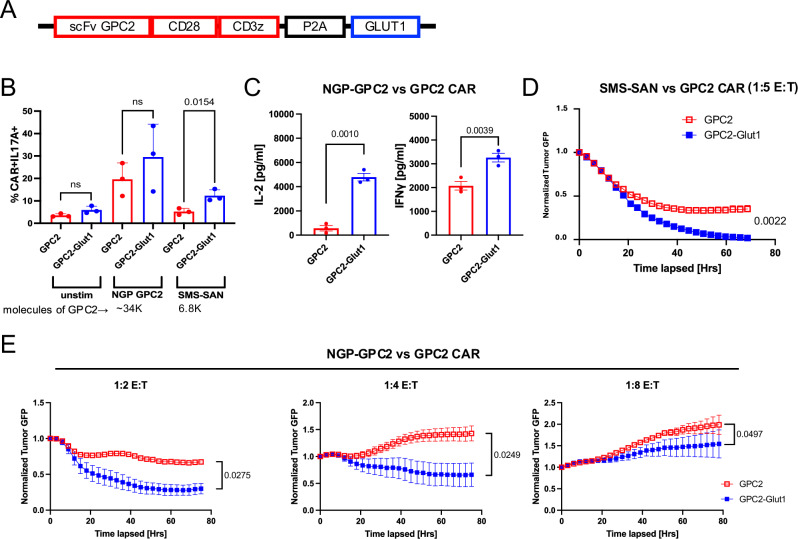
Fig. 9. GLUT1 overexpression increases potency of GPC2-CAR T cells against neuroblastoma in vitro.
A Design of GPC2 CAR and GLUT1 expressing vector (B) Intracellular cytokine staining after 24 h of GPC2 ± GLUT1OE CAR T cells stimulated with three different tumor lines on day 14. Error bars represent mean ± SD of triplicate wells from one donor. P values determined by unpaired two-tailed t-tests. C Day 14 post activation CAR T cells stimulated with NGP-GPC2 at 1:1 E:T ratio. IL-2 and IFNγ secretion was assessed 24 h post-stimulation via ELISA. Data from n = 3 donors. P values determined by paired two-tailed t-tests. Error bars represent SEM. D Day 14 post-activation CAR T cells stimulated with SMS-SAN-GL tumor line at 1:5 E:T ratio and tumor killing was assessed using Incucyte. Error bars represent mean ± SD of triplicate wells from one representative donor (n = 2 donors). P values determined by two-way ANOVA. E Tumor killing kinetics of GPC2 ± GLUT1OE CAR T cells challenged with NGP-GPC2 across E:Ts captured by Incucyte. P values determined by two-way ANOVA.

