FIGURE 1.

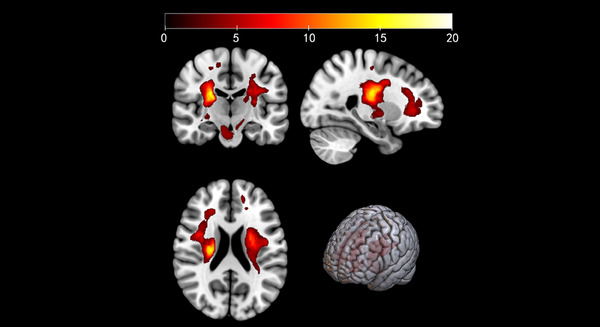
Distribution of stroke lesions in the entire sample of patients. The color scale represents number of participants with lesioned voxel as evaluated by T1 images.

Distribution of stroke lesions in the entire sample of patients. The color scale represents number of participants with lesioned voxel as evaluated by T1 images.